Nobody needs SEO like NerdWallet.
Their S-1 shows over 70% of traffic is unpaid. For a business that transforms knowledge-seeking into profit, that’s a perfect strategy.
But it’s also imperfect. As a public company, NerdWallet must openly admit when its SEO fails. Worse still, dips in organic traffic can trigger falling stock prices and potential job losses. Lower organic can trigger falling stock prices, which can lead to job losses. And when Google tweaks its algorithms, it sends ripples through NerdWallet’s entire ecosystem—from employees to stockholders.
Can you name another company with more skin in the SEO game?
NerdWallet’s journey offers a masterclass in SEO strategy and adaptation. Their SEO success story is impressive, to say the least, but they’re walking a tightrope where missteps aren’t an option. This is precisely why there will always be much to learn from NerdWallet.
Here are some things I learned from spending too much time in Numberland with NerdWallet.
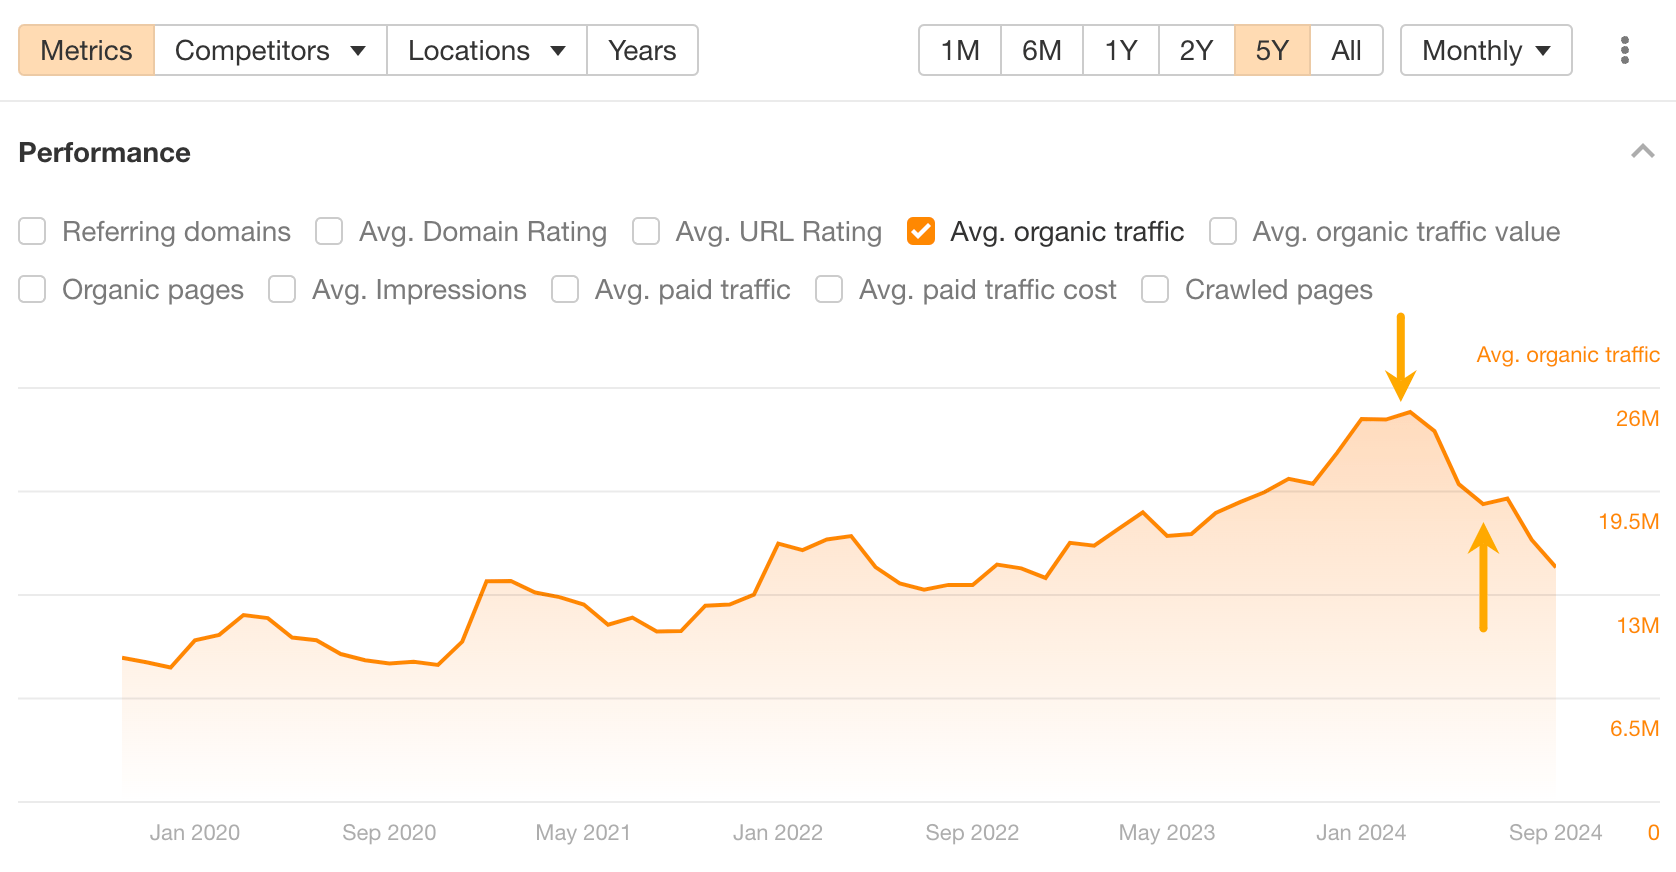
This loss was caused by “unexpected headwinds”, as their CEO put it in the 2024 Q2 financial report. And it looks like the loss in traffic resulted in a significant loss in revenue and stock value.
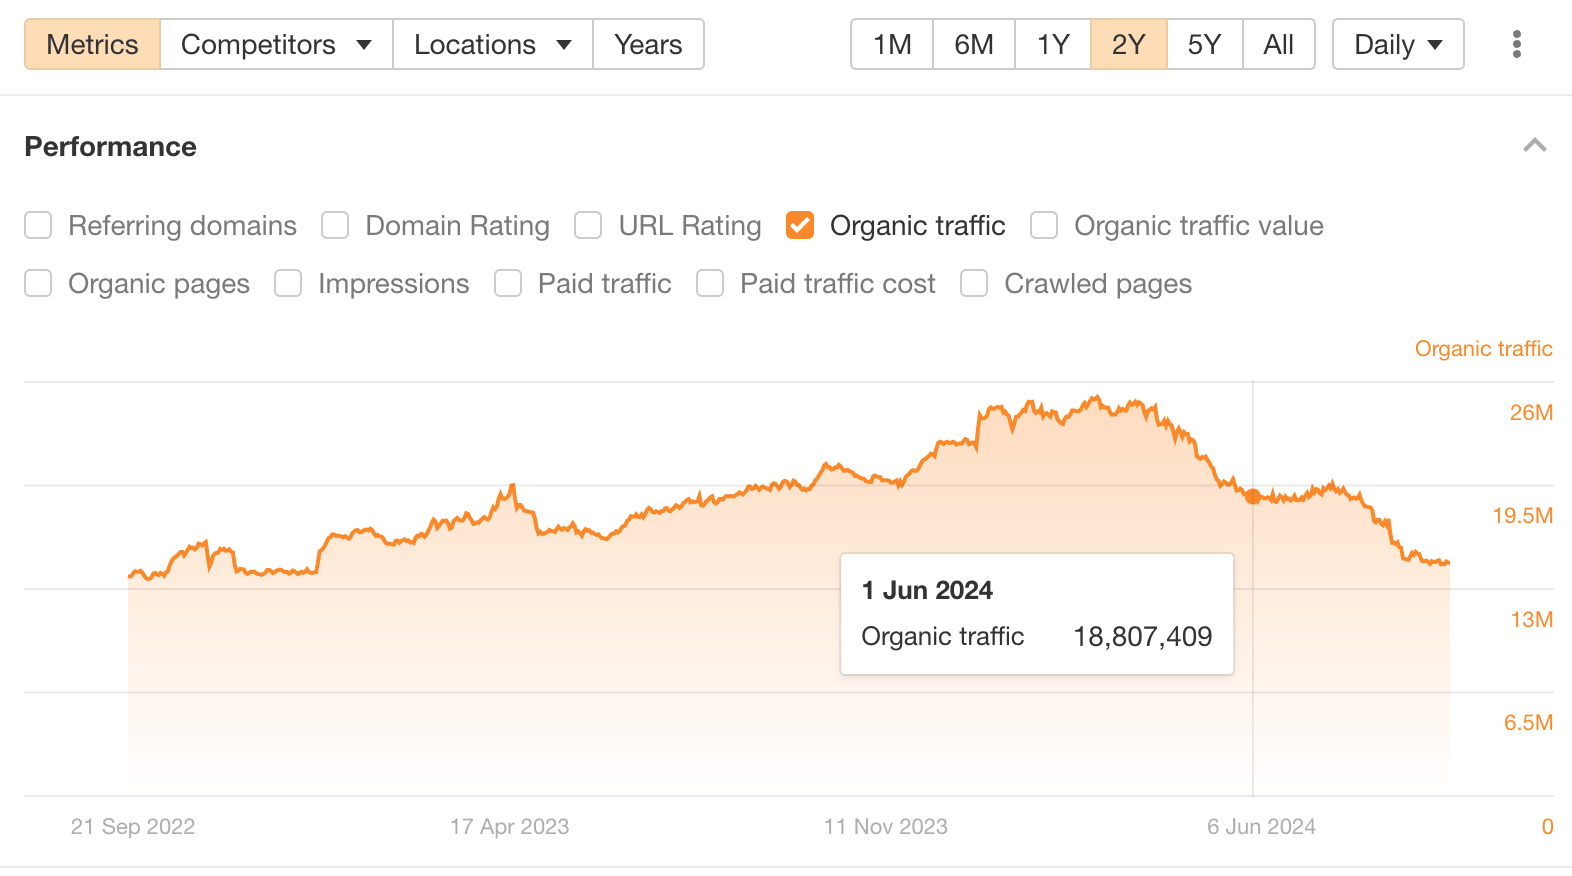
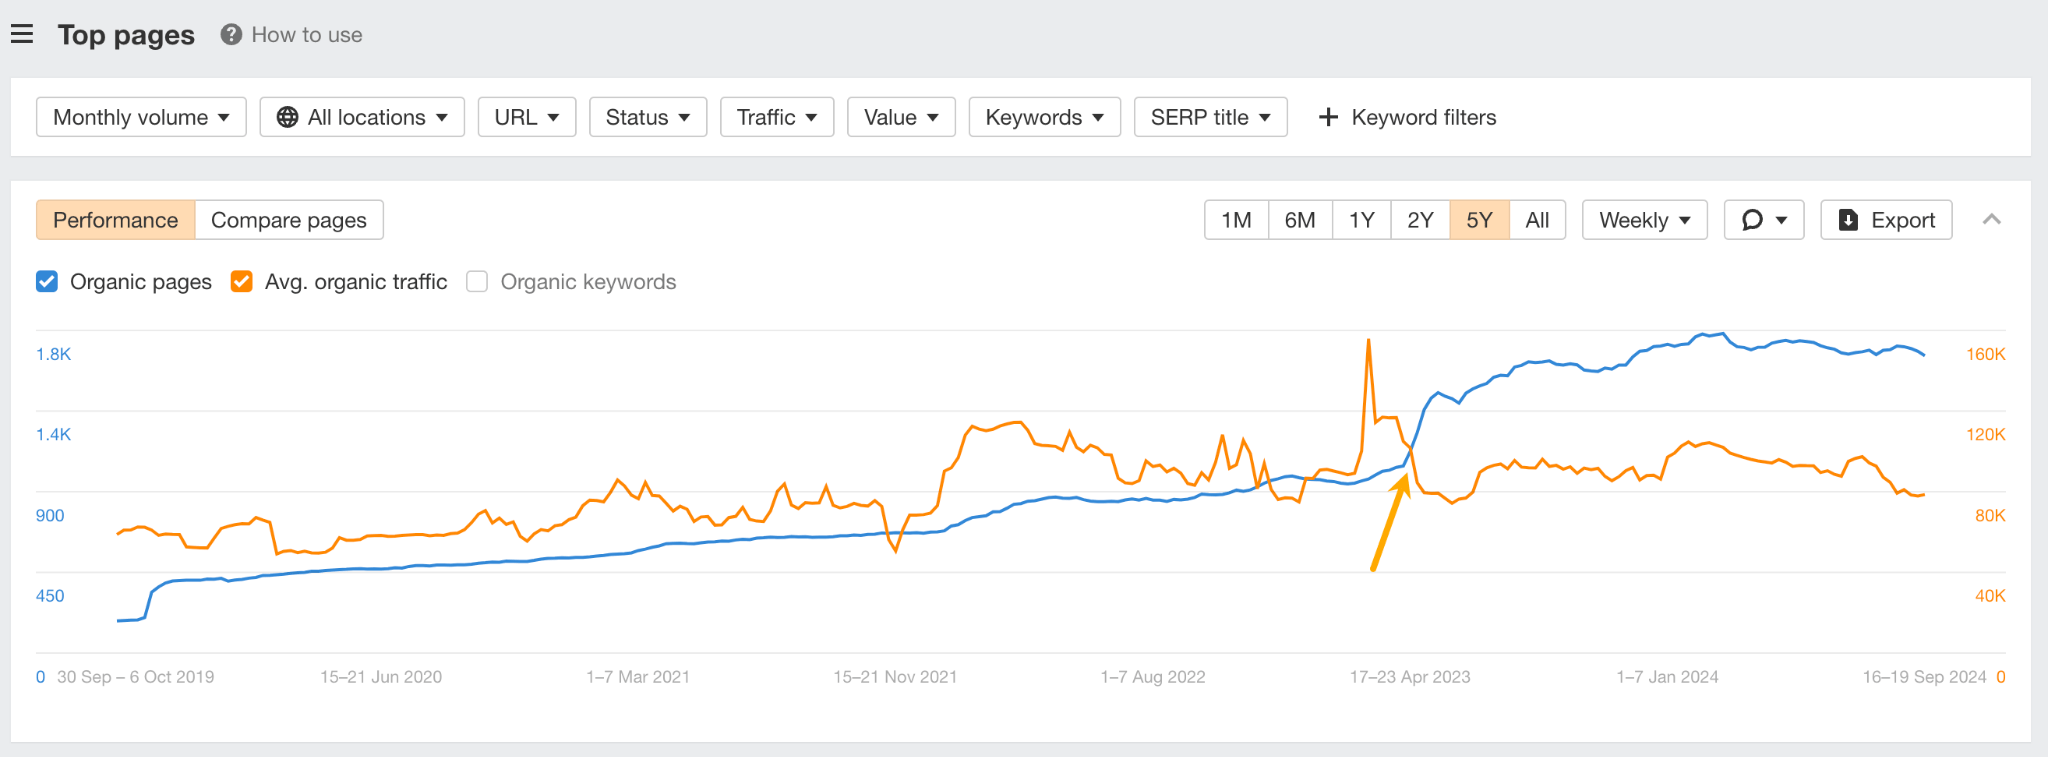
Here’s what the traffic looked like before the start of Q3 2024.
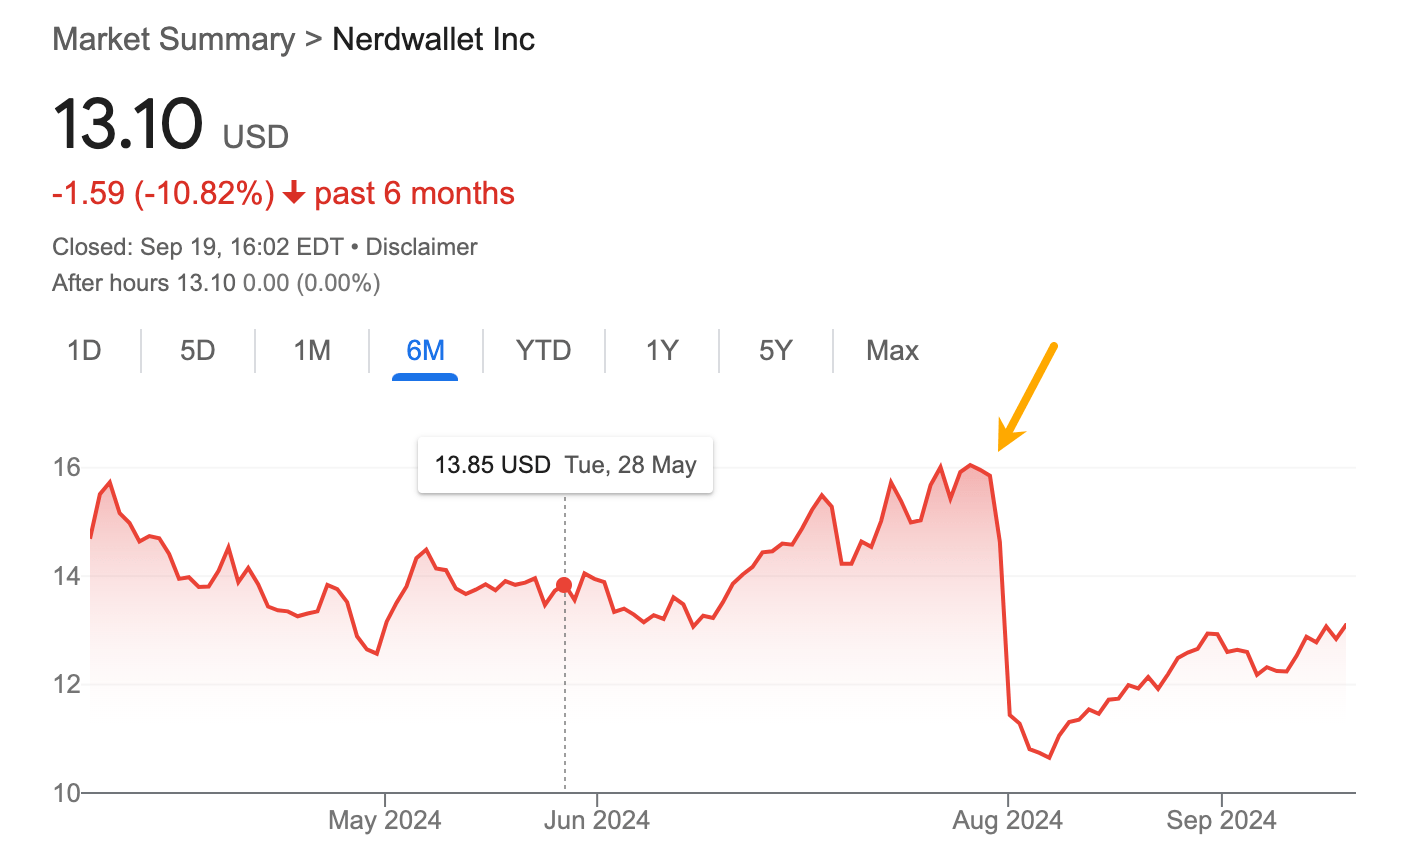
And this is how the stock value chart looked when they told everyone how the traffic looked.
Interestingly, it happened around the same time as the recent March core update. The update was said to “fix” what you see on Google’s search results by 40% by literally punishing sites that tried to take advantage of Google.
Was it the update that hit NerdWallet so badly?
Julien Brault speculates it might have been because of Google’s new rich result type.
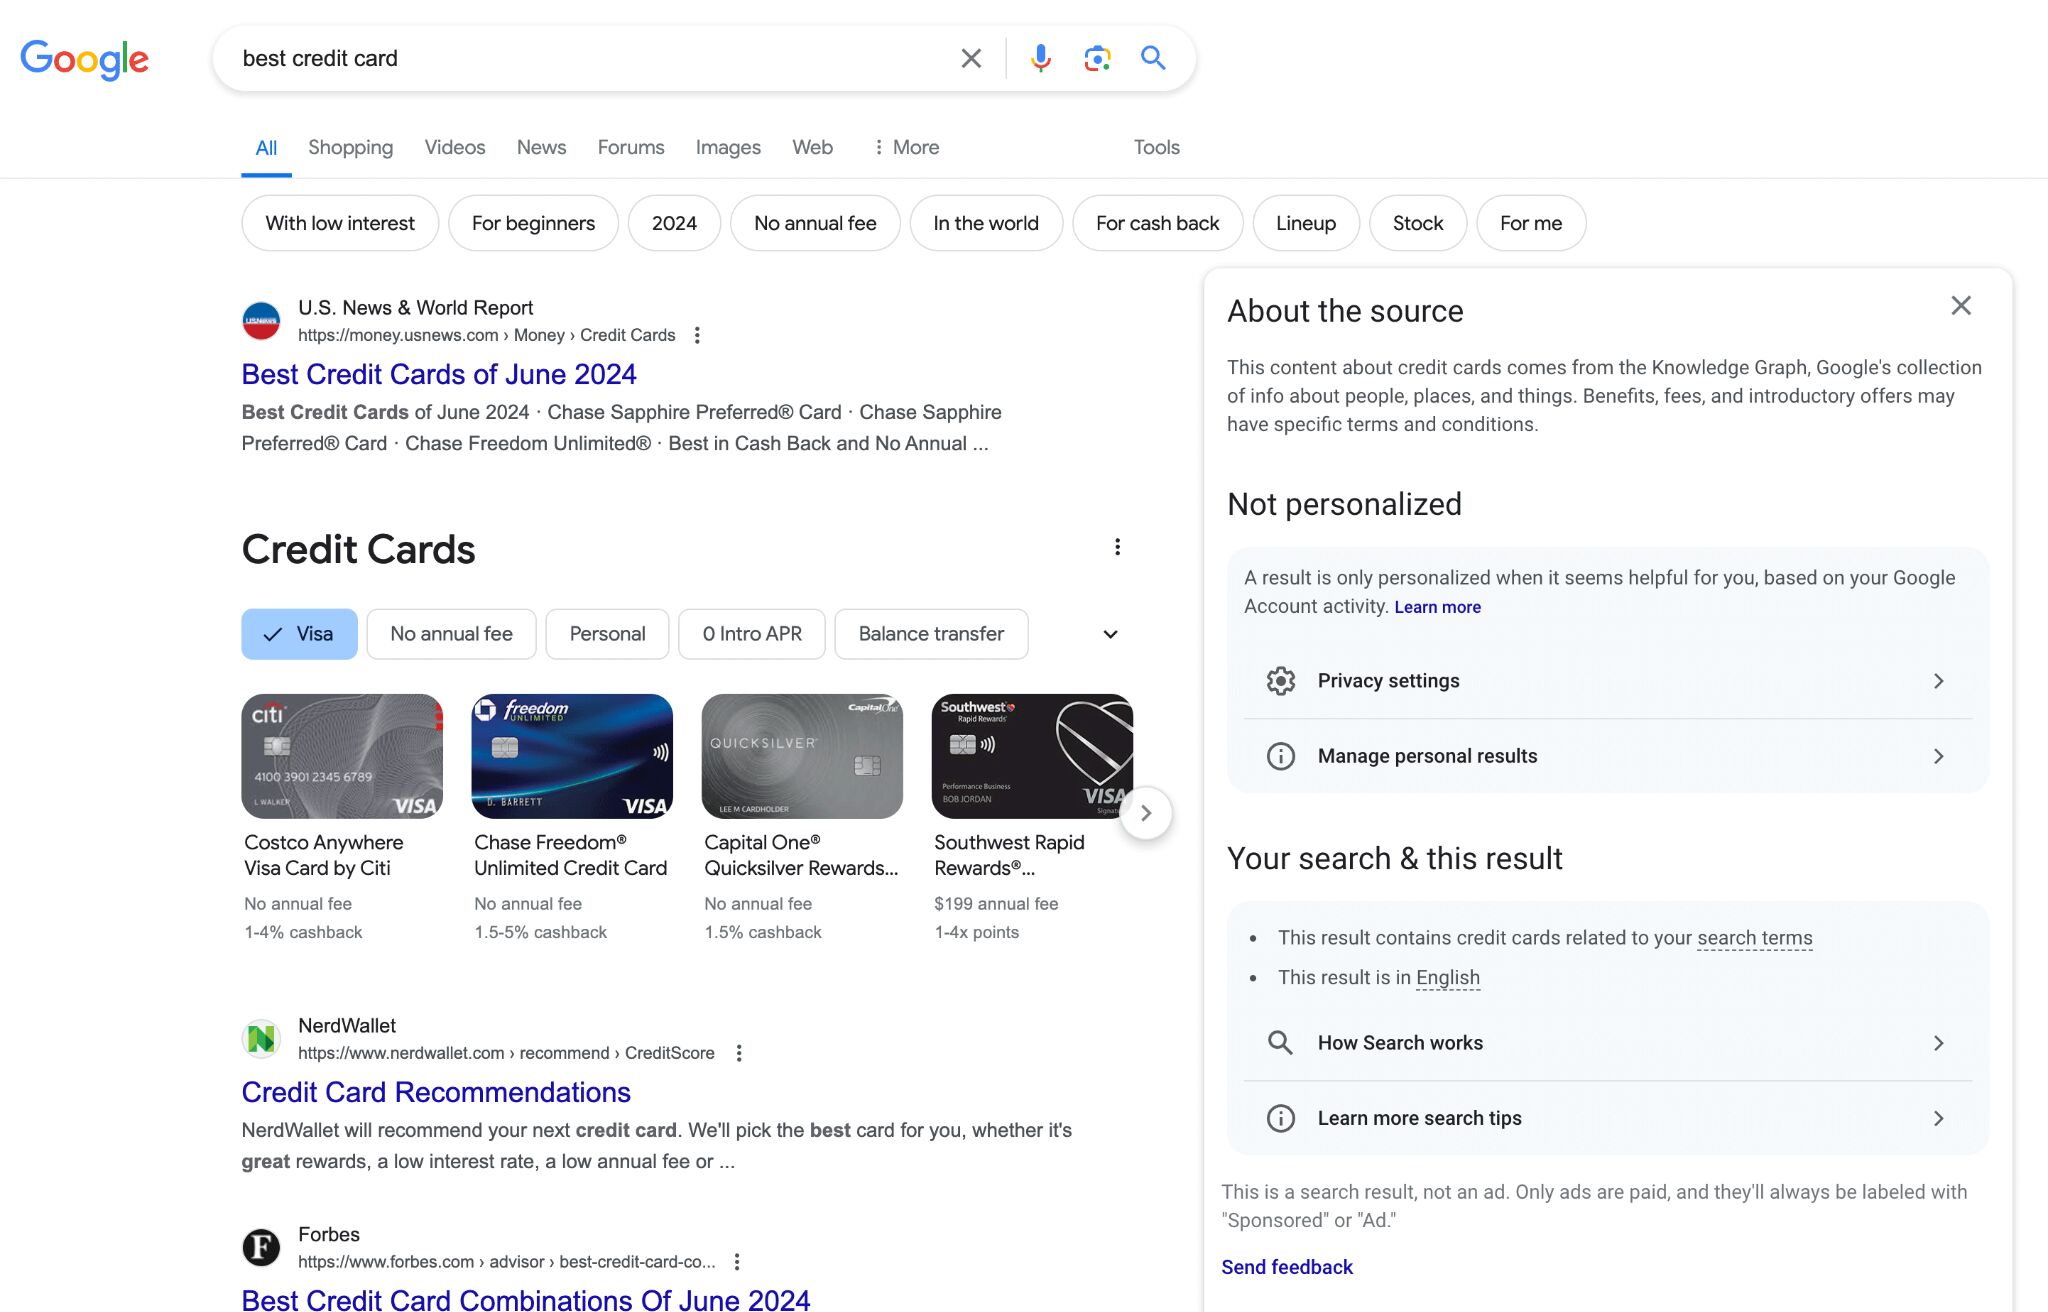
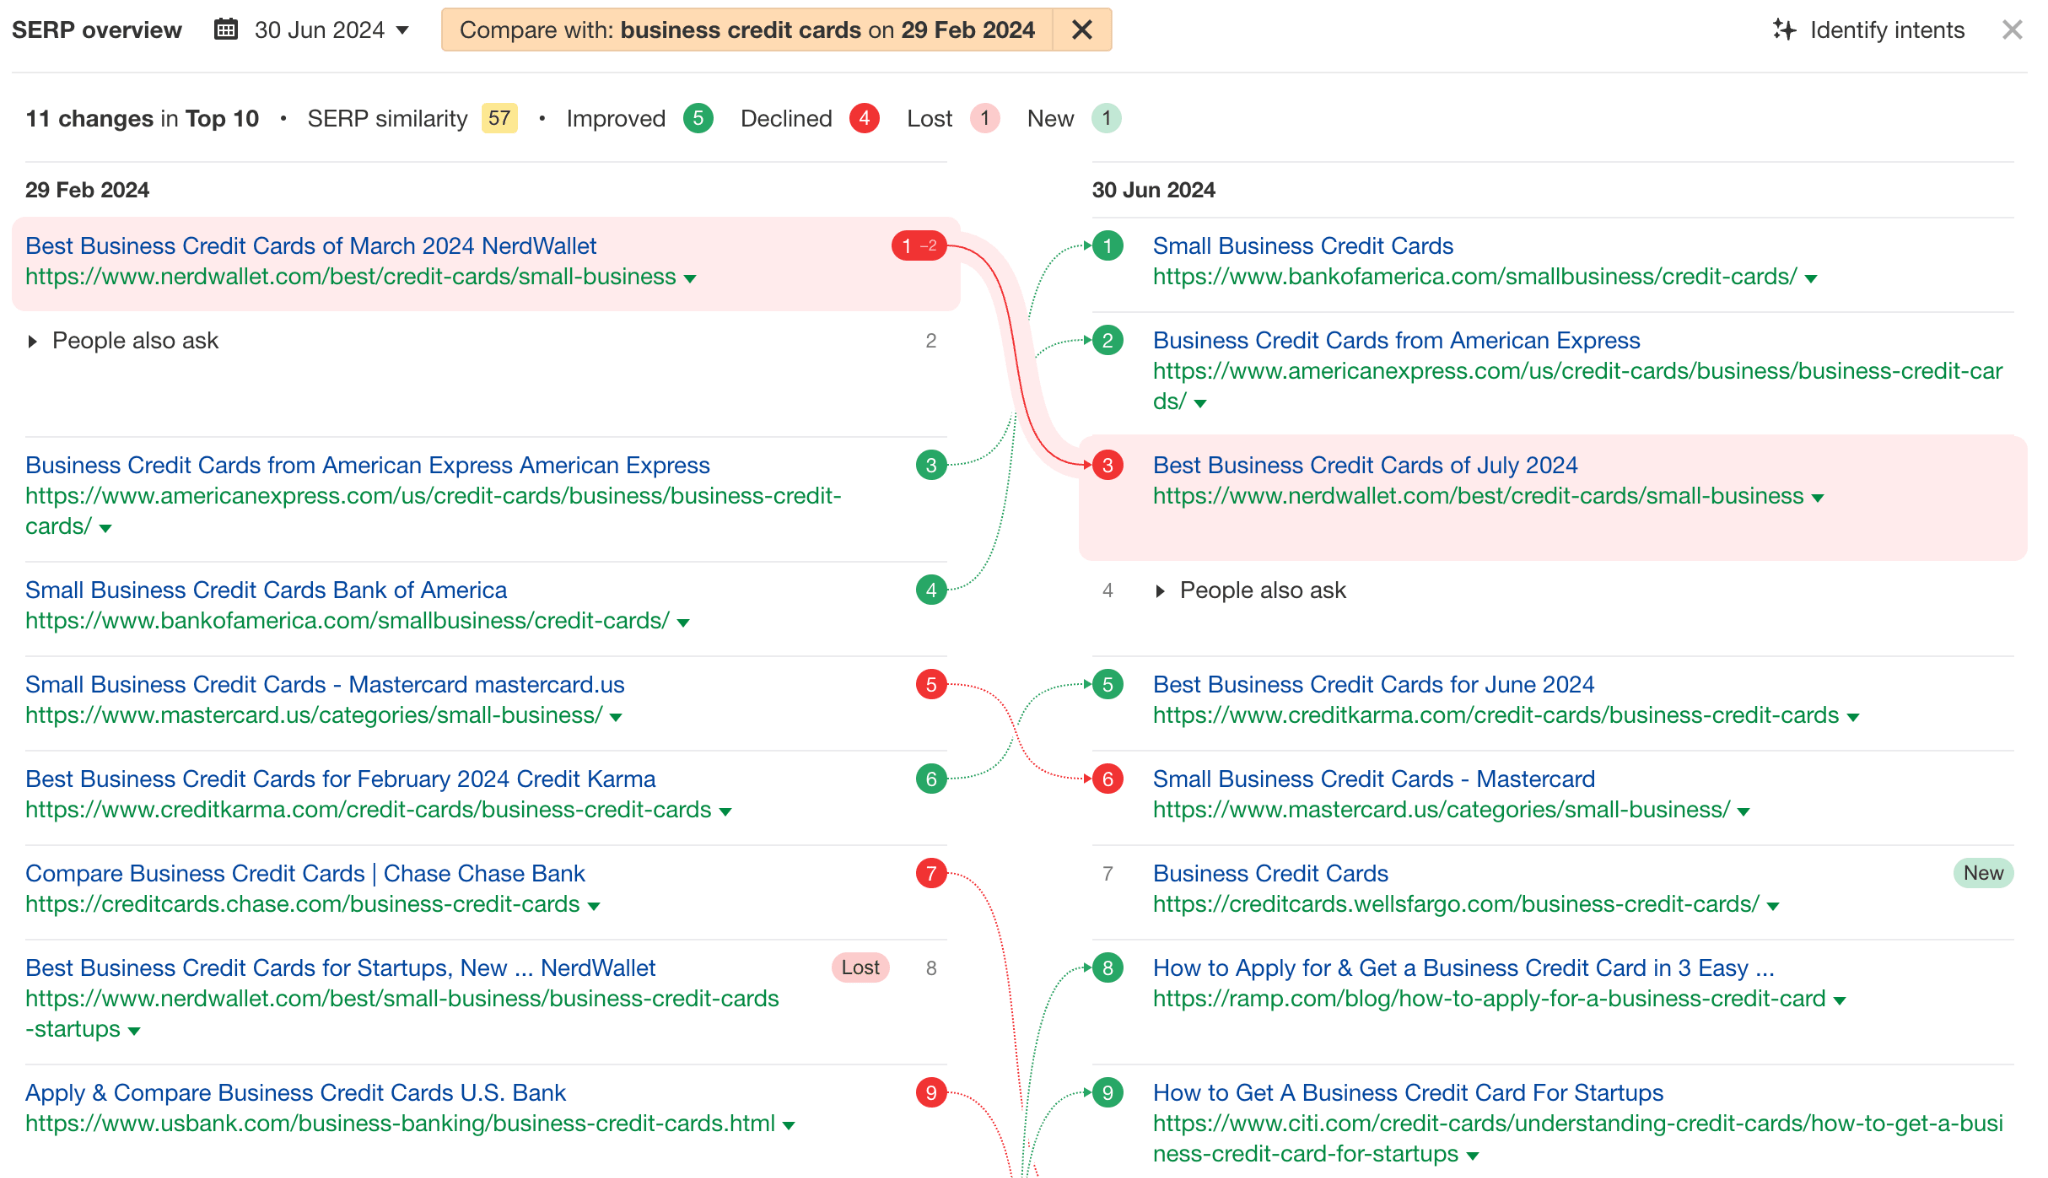
As Search Engine Round Table reports, Starting June 2024, Google may show credit cards right inside the SERPs. This means less traffic for everyone who wants to rank for “best credit cards”, including NerdWallet.
But the traffic slump started before that. By June 1st, it was actually all over.
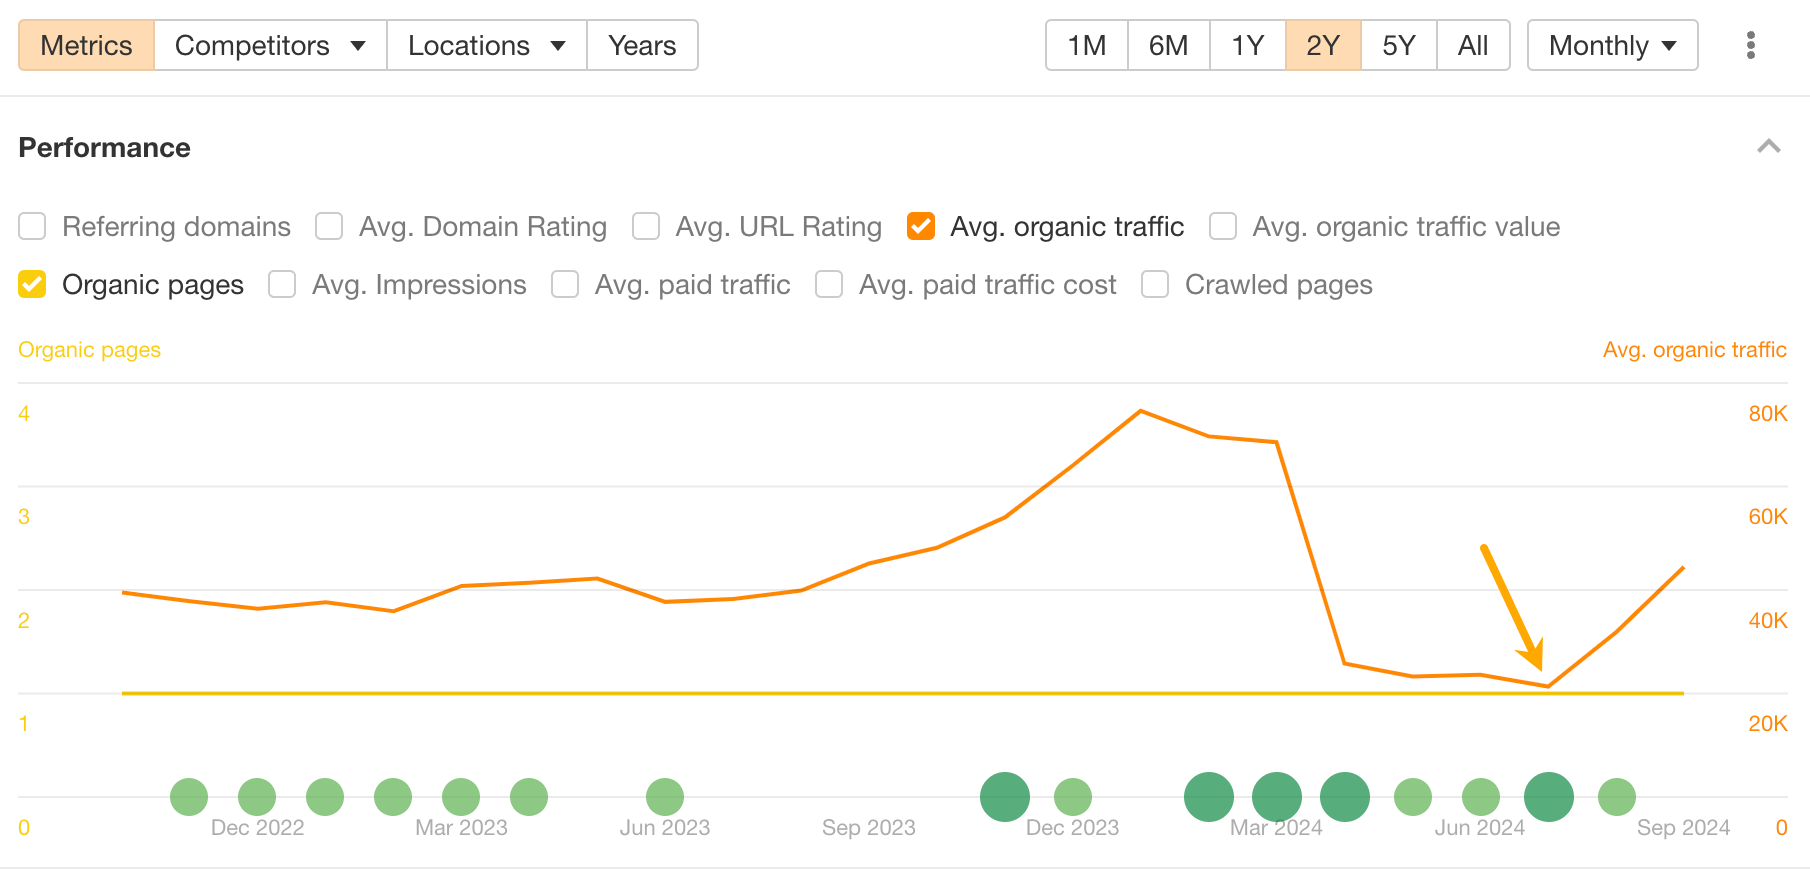
I think there were multiple reasons for this slump in traffic. One of them was search demand seasonality for some of their “fattest” keywords. Here’s an example.
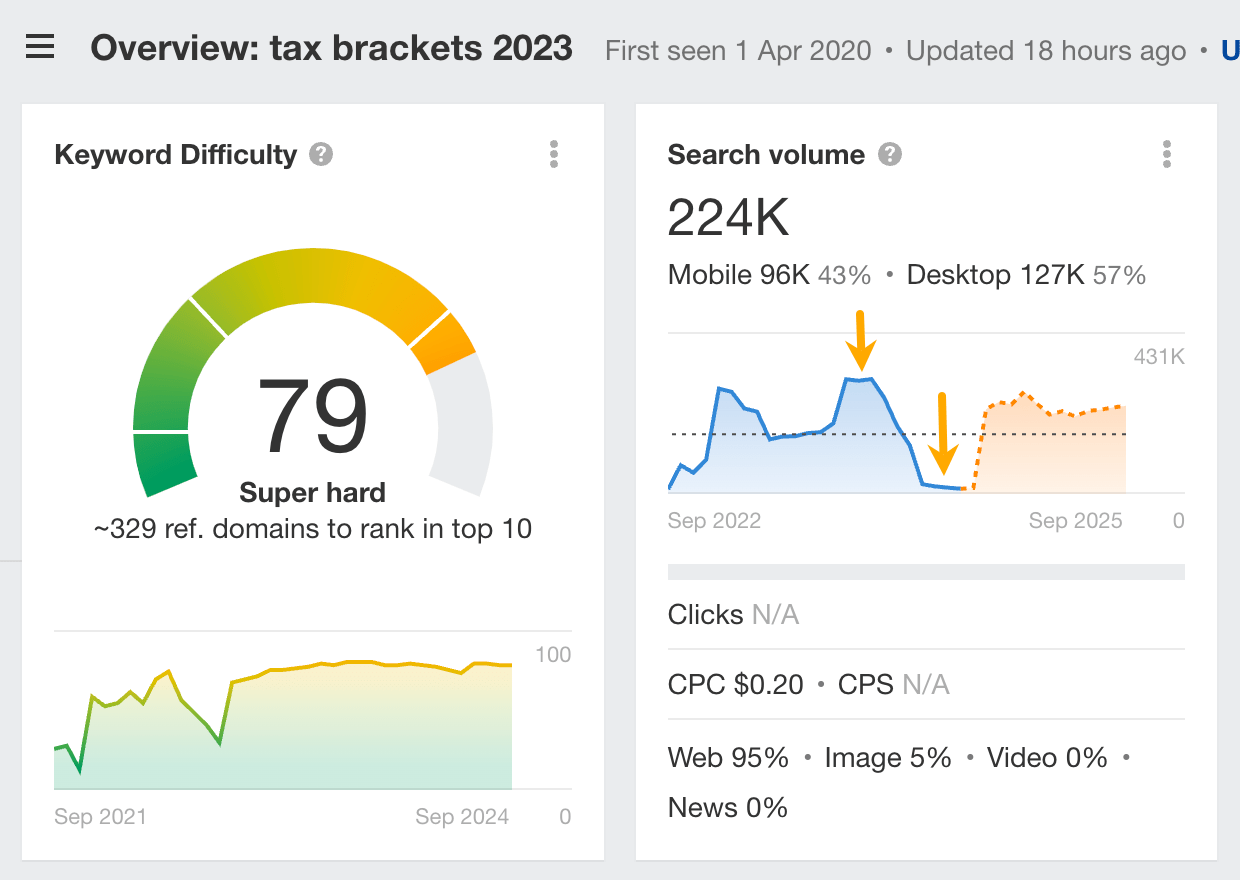
This explains why their yearly traffic dips around the same time. But notice how they bounce back stronger after each drop.
Other reasons:
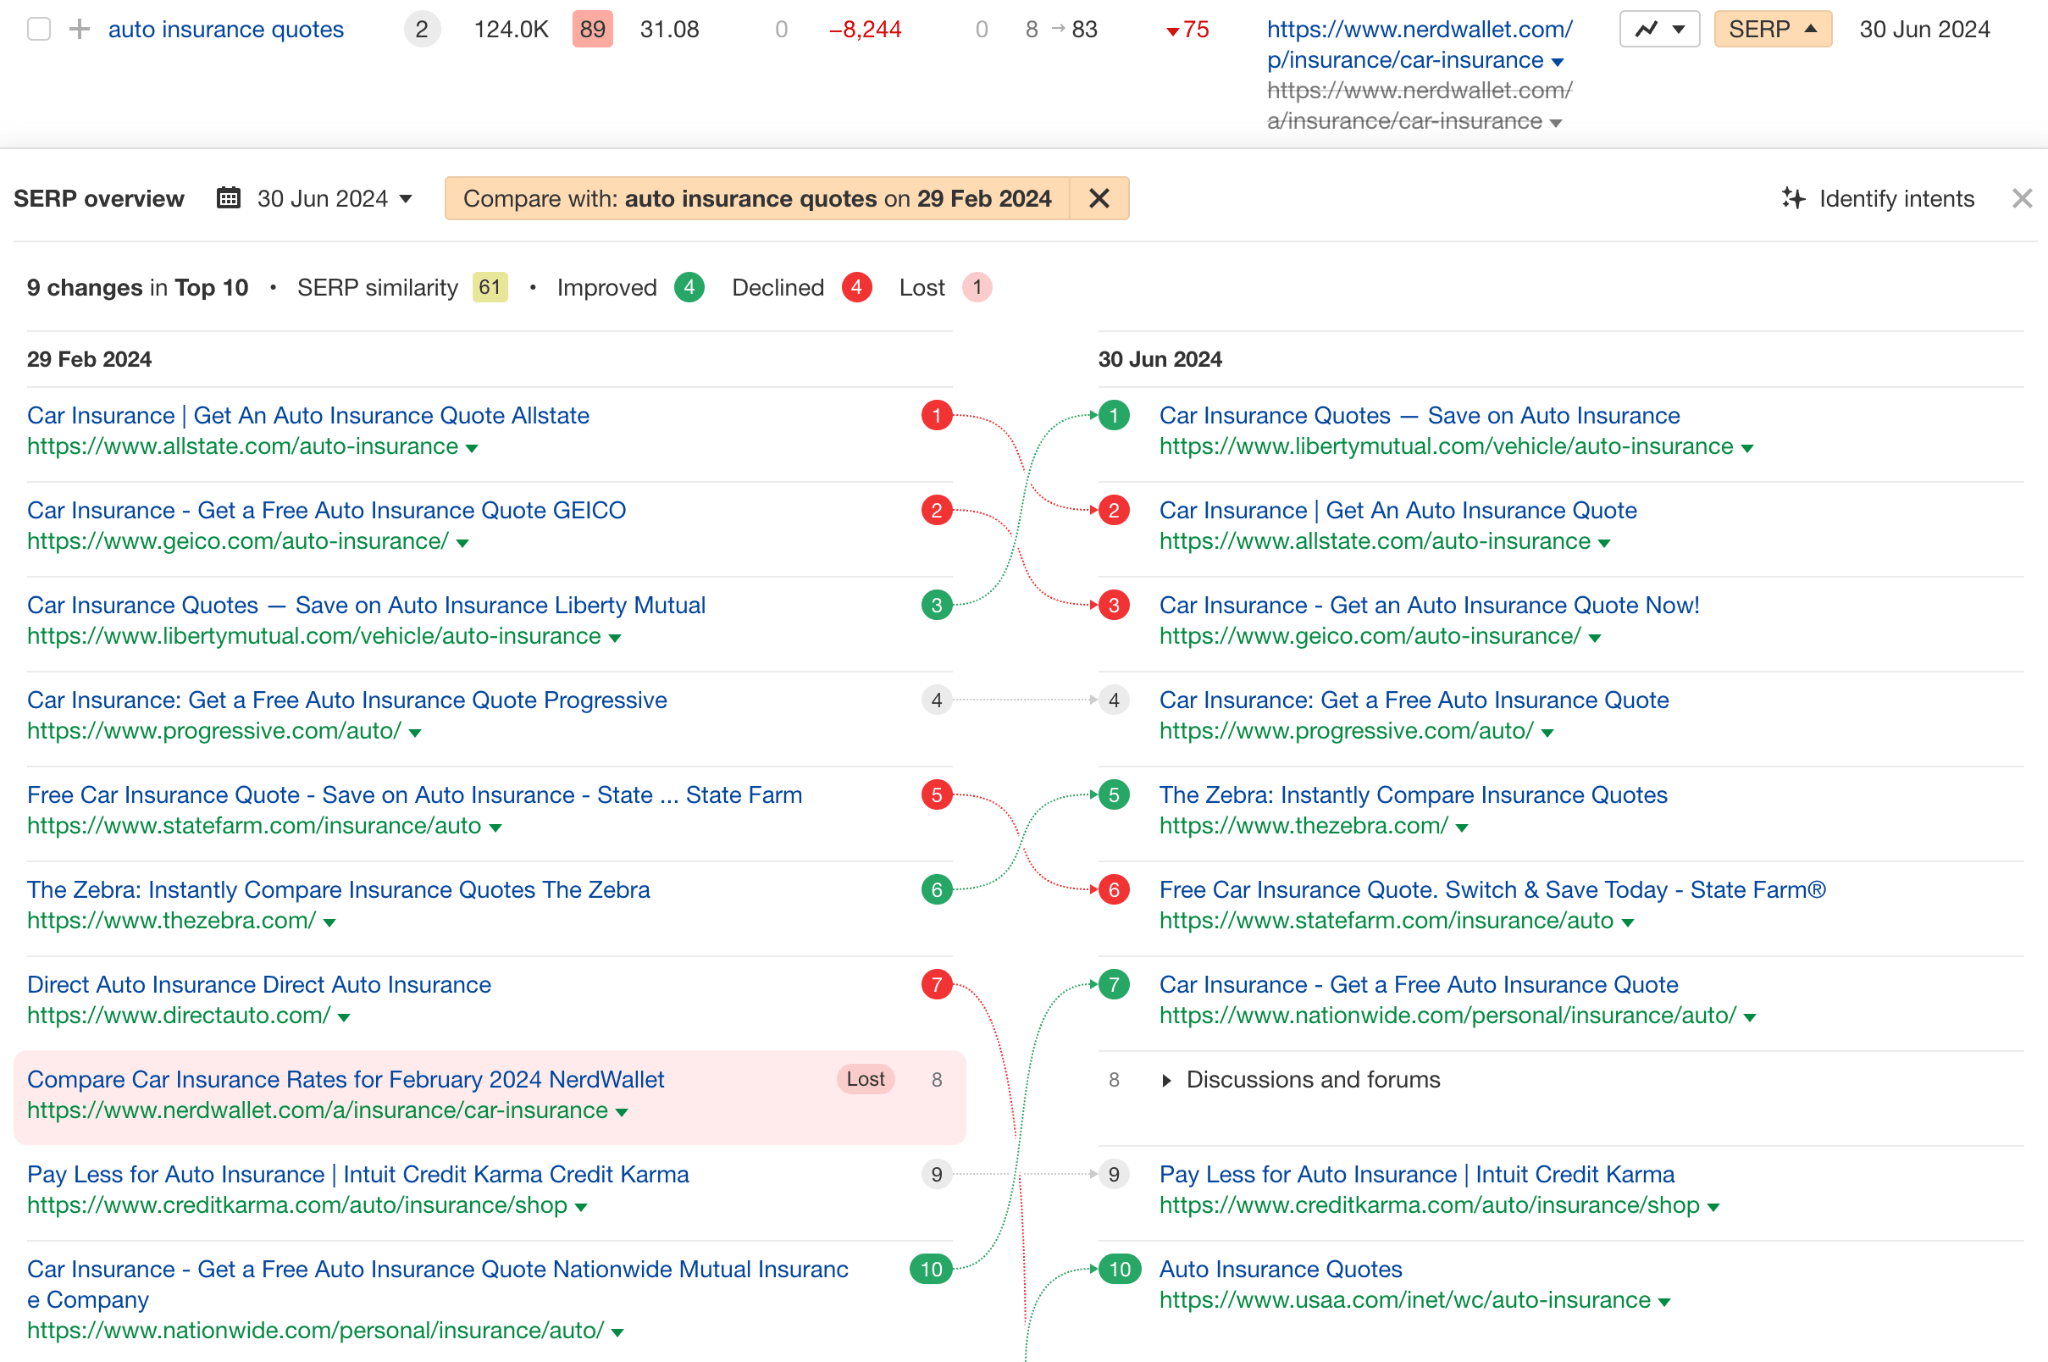
- They dropped a few spots to direct competitors. This is par for the course in SEO.
- They saw a few big drops, outranked by a different breed of sites. It looked as if Google had replaced the old goods with new ones.
I will go deeper into the cause of the loss in a bit.
For NerdWallet, writing about topics like “rv rental” might be a poor bet for organic traffic in this climate. Readers might still find and trust this content through other channels, given the strong brand in finance. However, the outlook for ranking recovery or future competition in these areas looks poor.
Whether this benefits consumers is debatable. Personally, I might prefer NerdWallet’s partner offers for travel over someone’s niche travel stories about trips I’d never take.
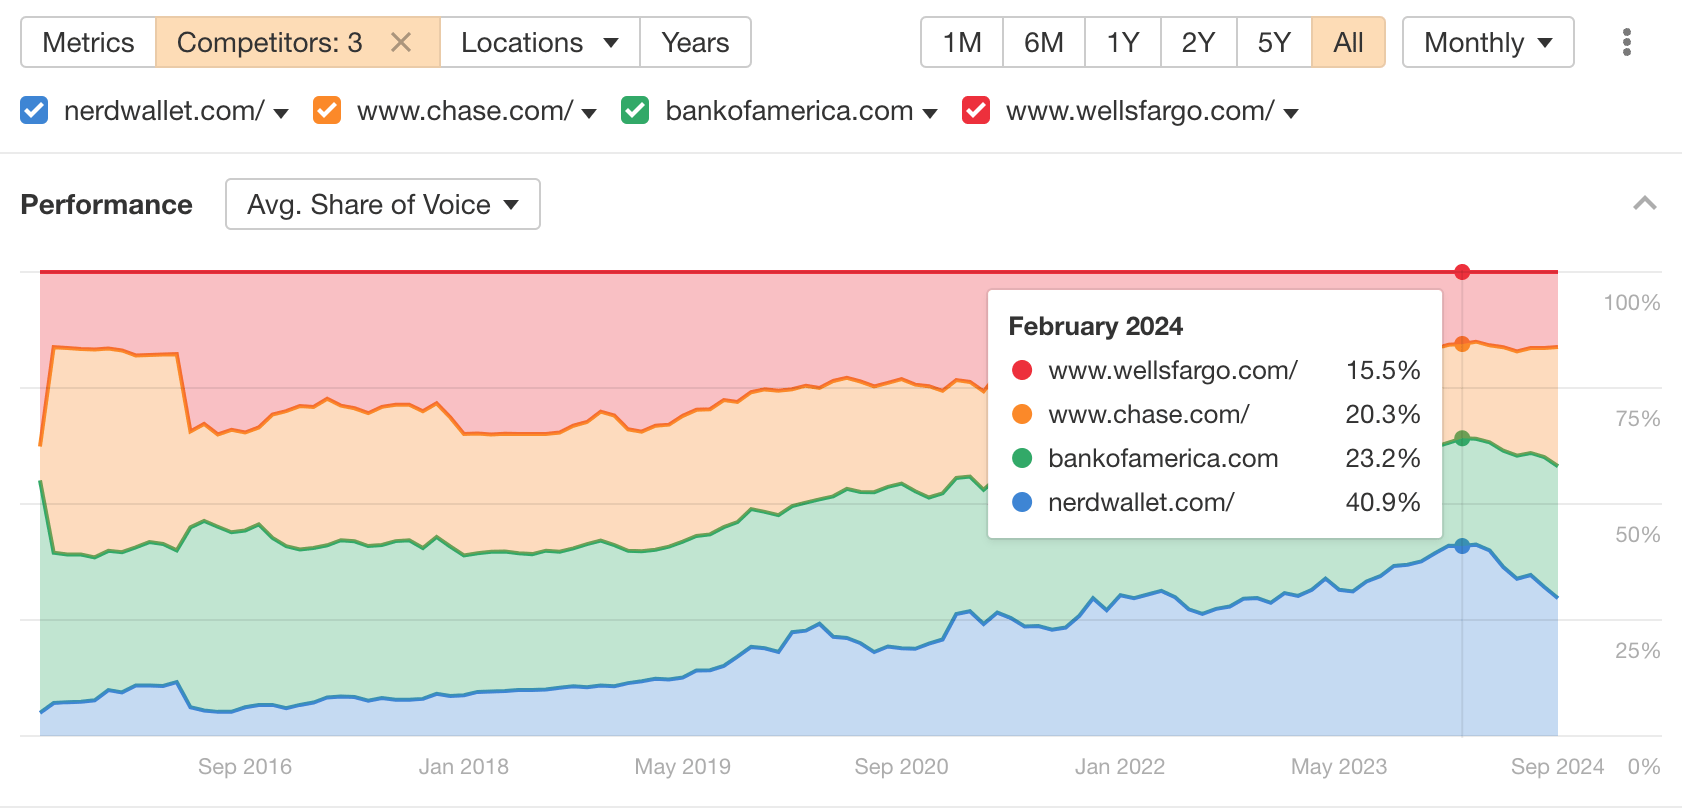
Type 3 winners. Big brands offering the products that NerdWallet writes about; mostly financial providers. And that includes their partners like Chase or Wells Fargo.
I’ve seen many such cases. Together with type 2, these keywords fell in rankings the most.
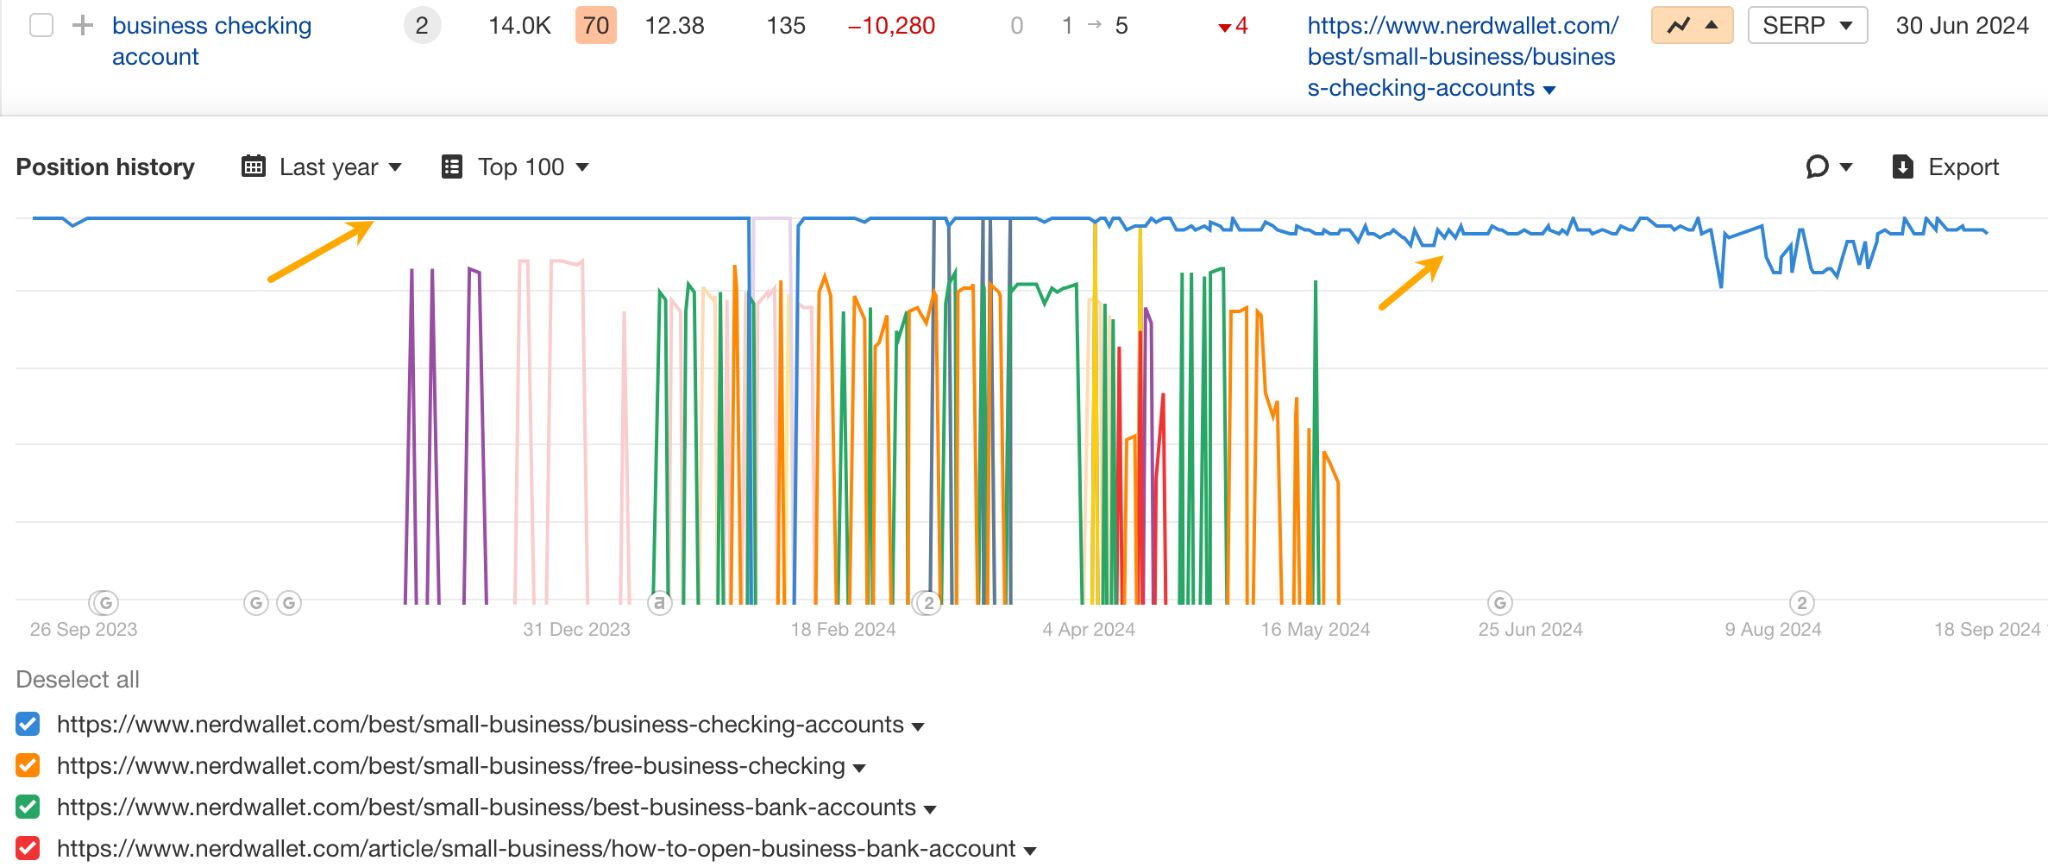
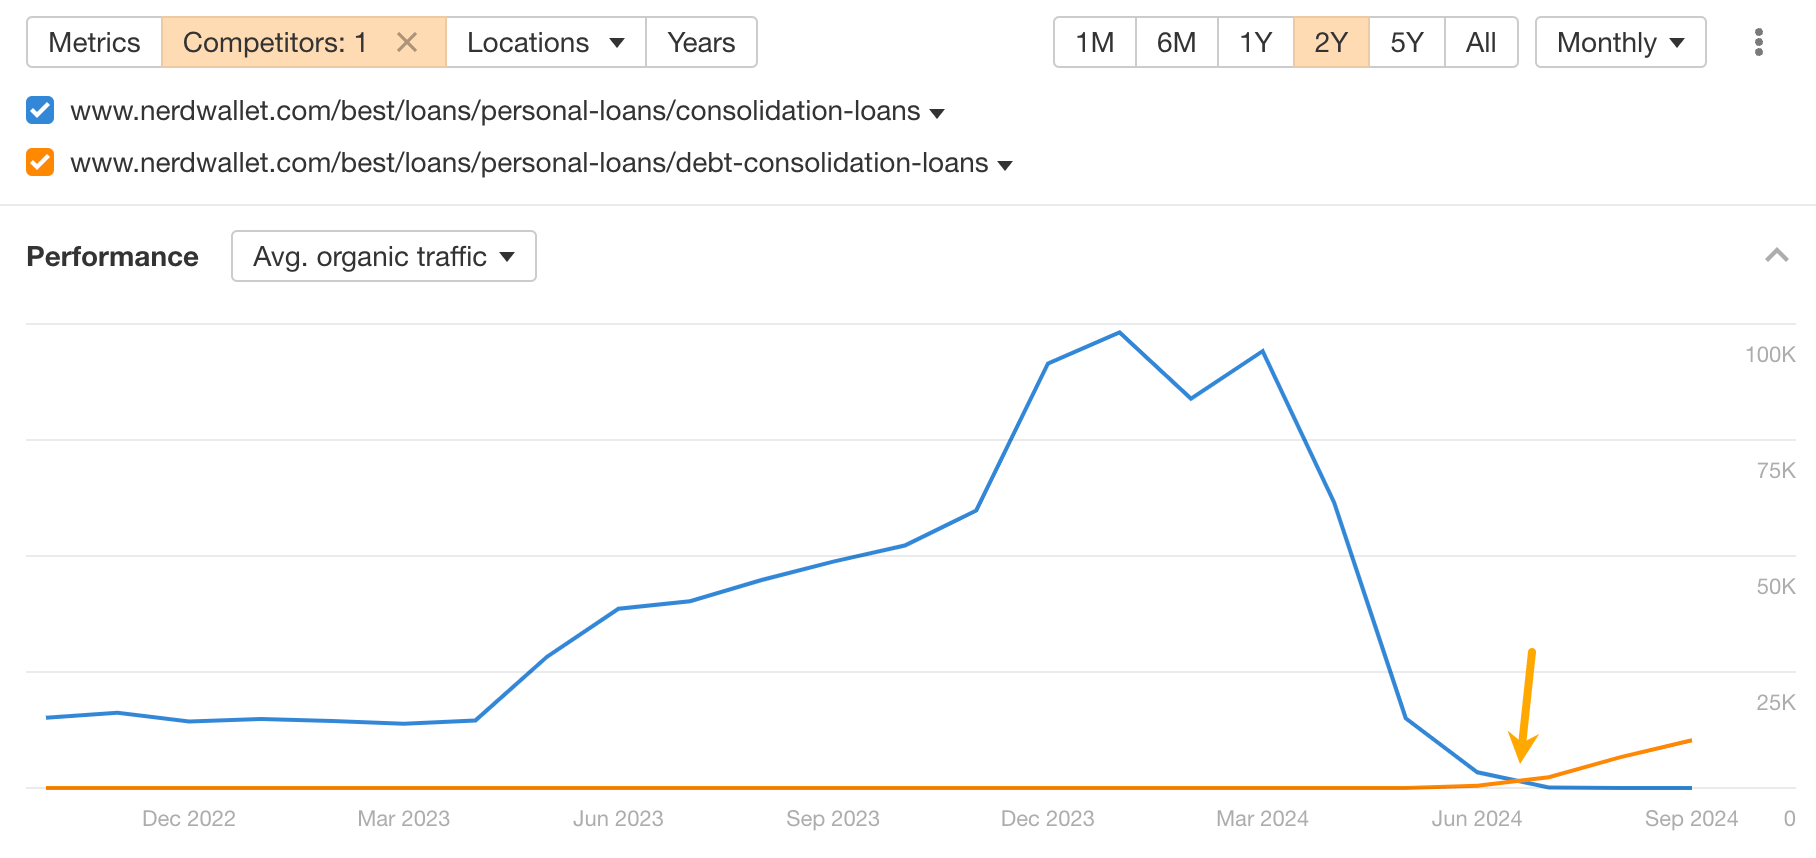
I also looked at some of the ranking history charts and I think I know which “headwinds” rocked the boat. For instance, look at the chart below — nice, steady drifting, and then it hits.
It could be argued that it’s fair for, say, Chase to outrank NerdWallet for branded queries. But what if the outranking content is a comparison of the bank’s credit card and the content that loses is a market-wide comparison of credit cards? Which is better for the consumer?
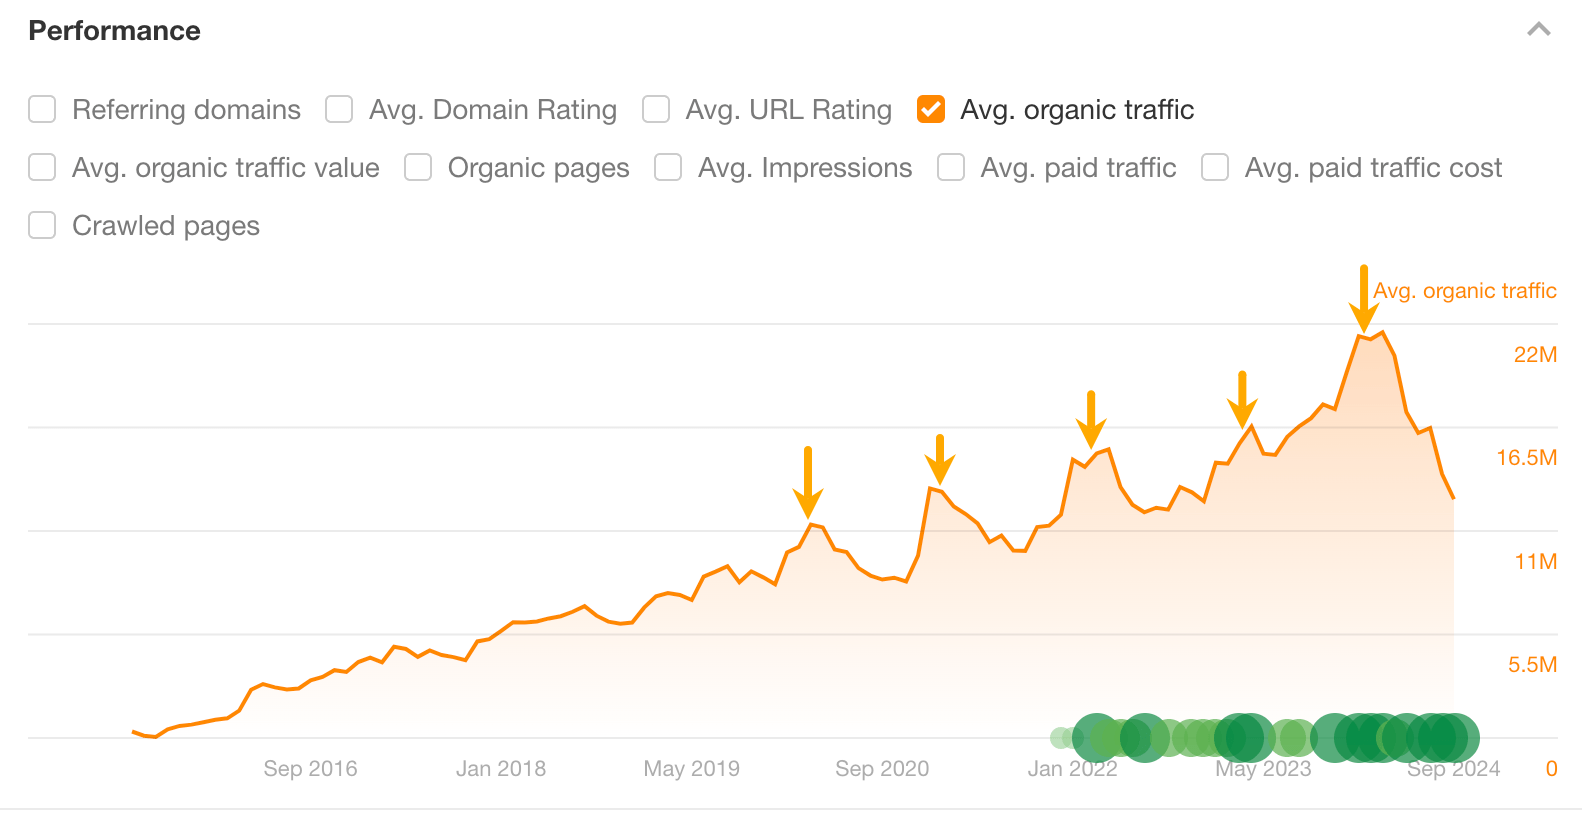
In the graph below, you can see the moment of the big update (dark green circle) and the lift in traffic that came after.
Second tactic. When tweaking content failed, they relocated pages to a new directory. This move appears to give the content a “fresh start” while retaining the link equity from its original location.
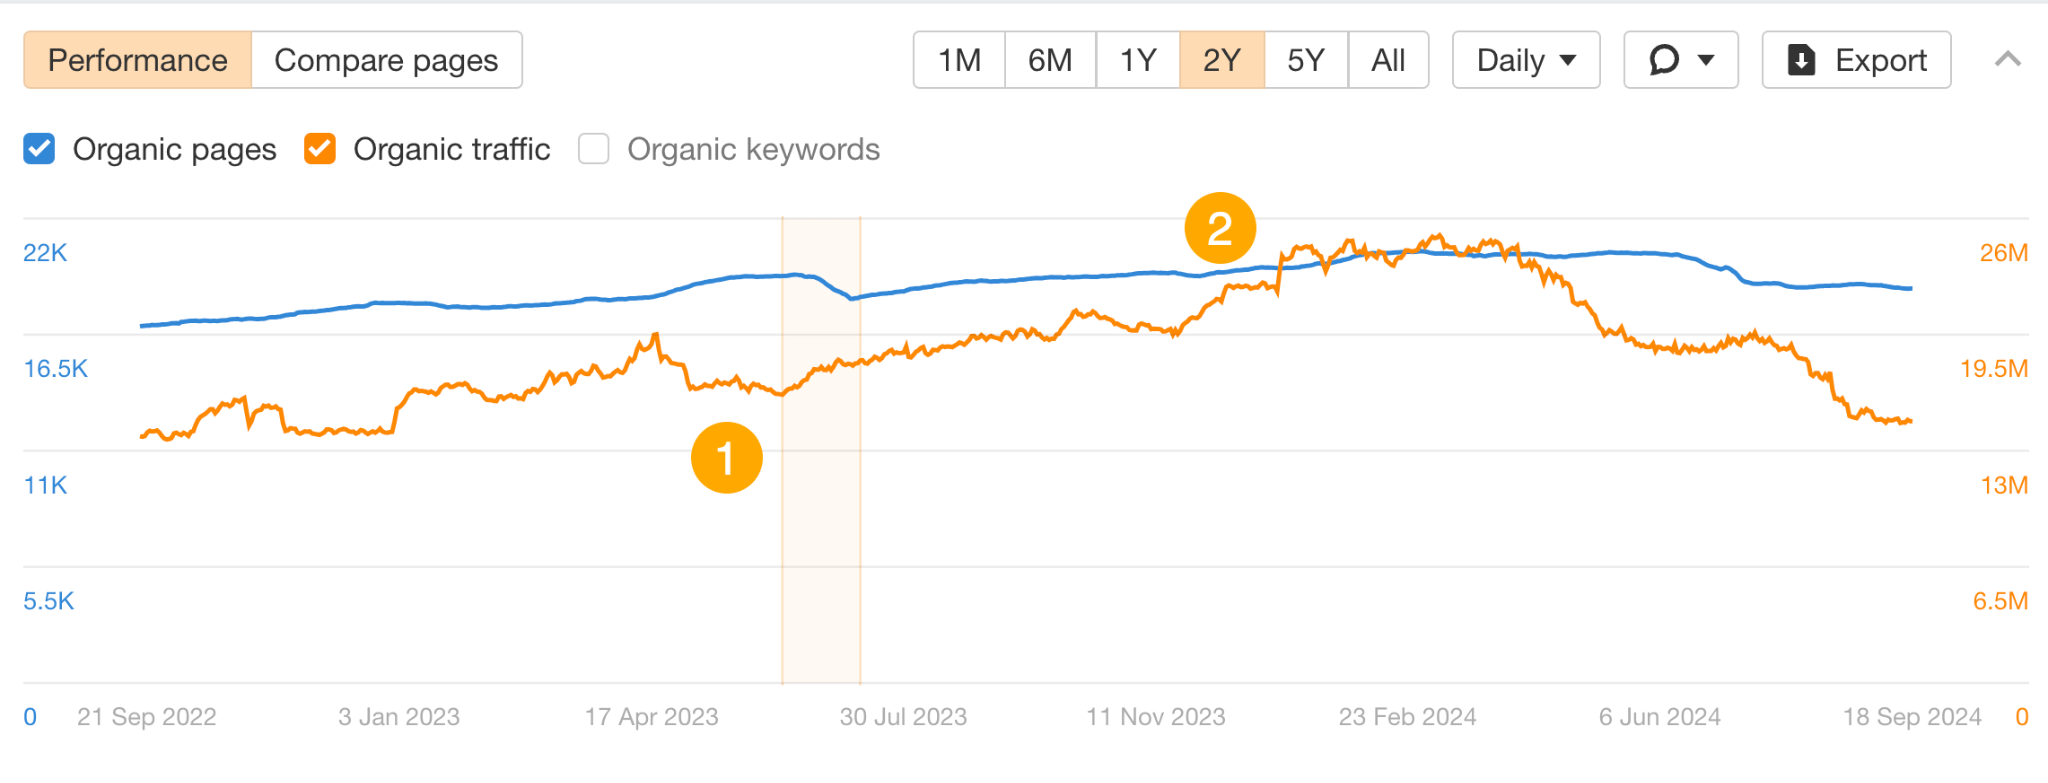
With this type of pruning (redirects), sometimes you can see results shortly after. For example, in 2023, the results came immediately (1). The next time they had the same number of pages as before the cut, their traffic was up by 4 million (2).
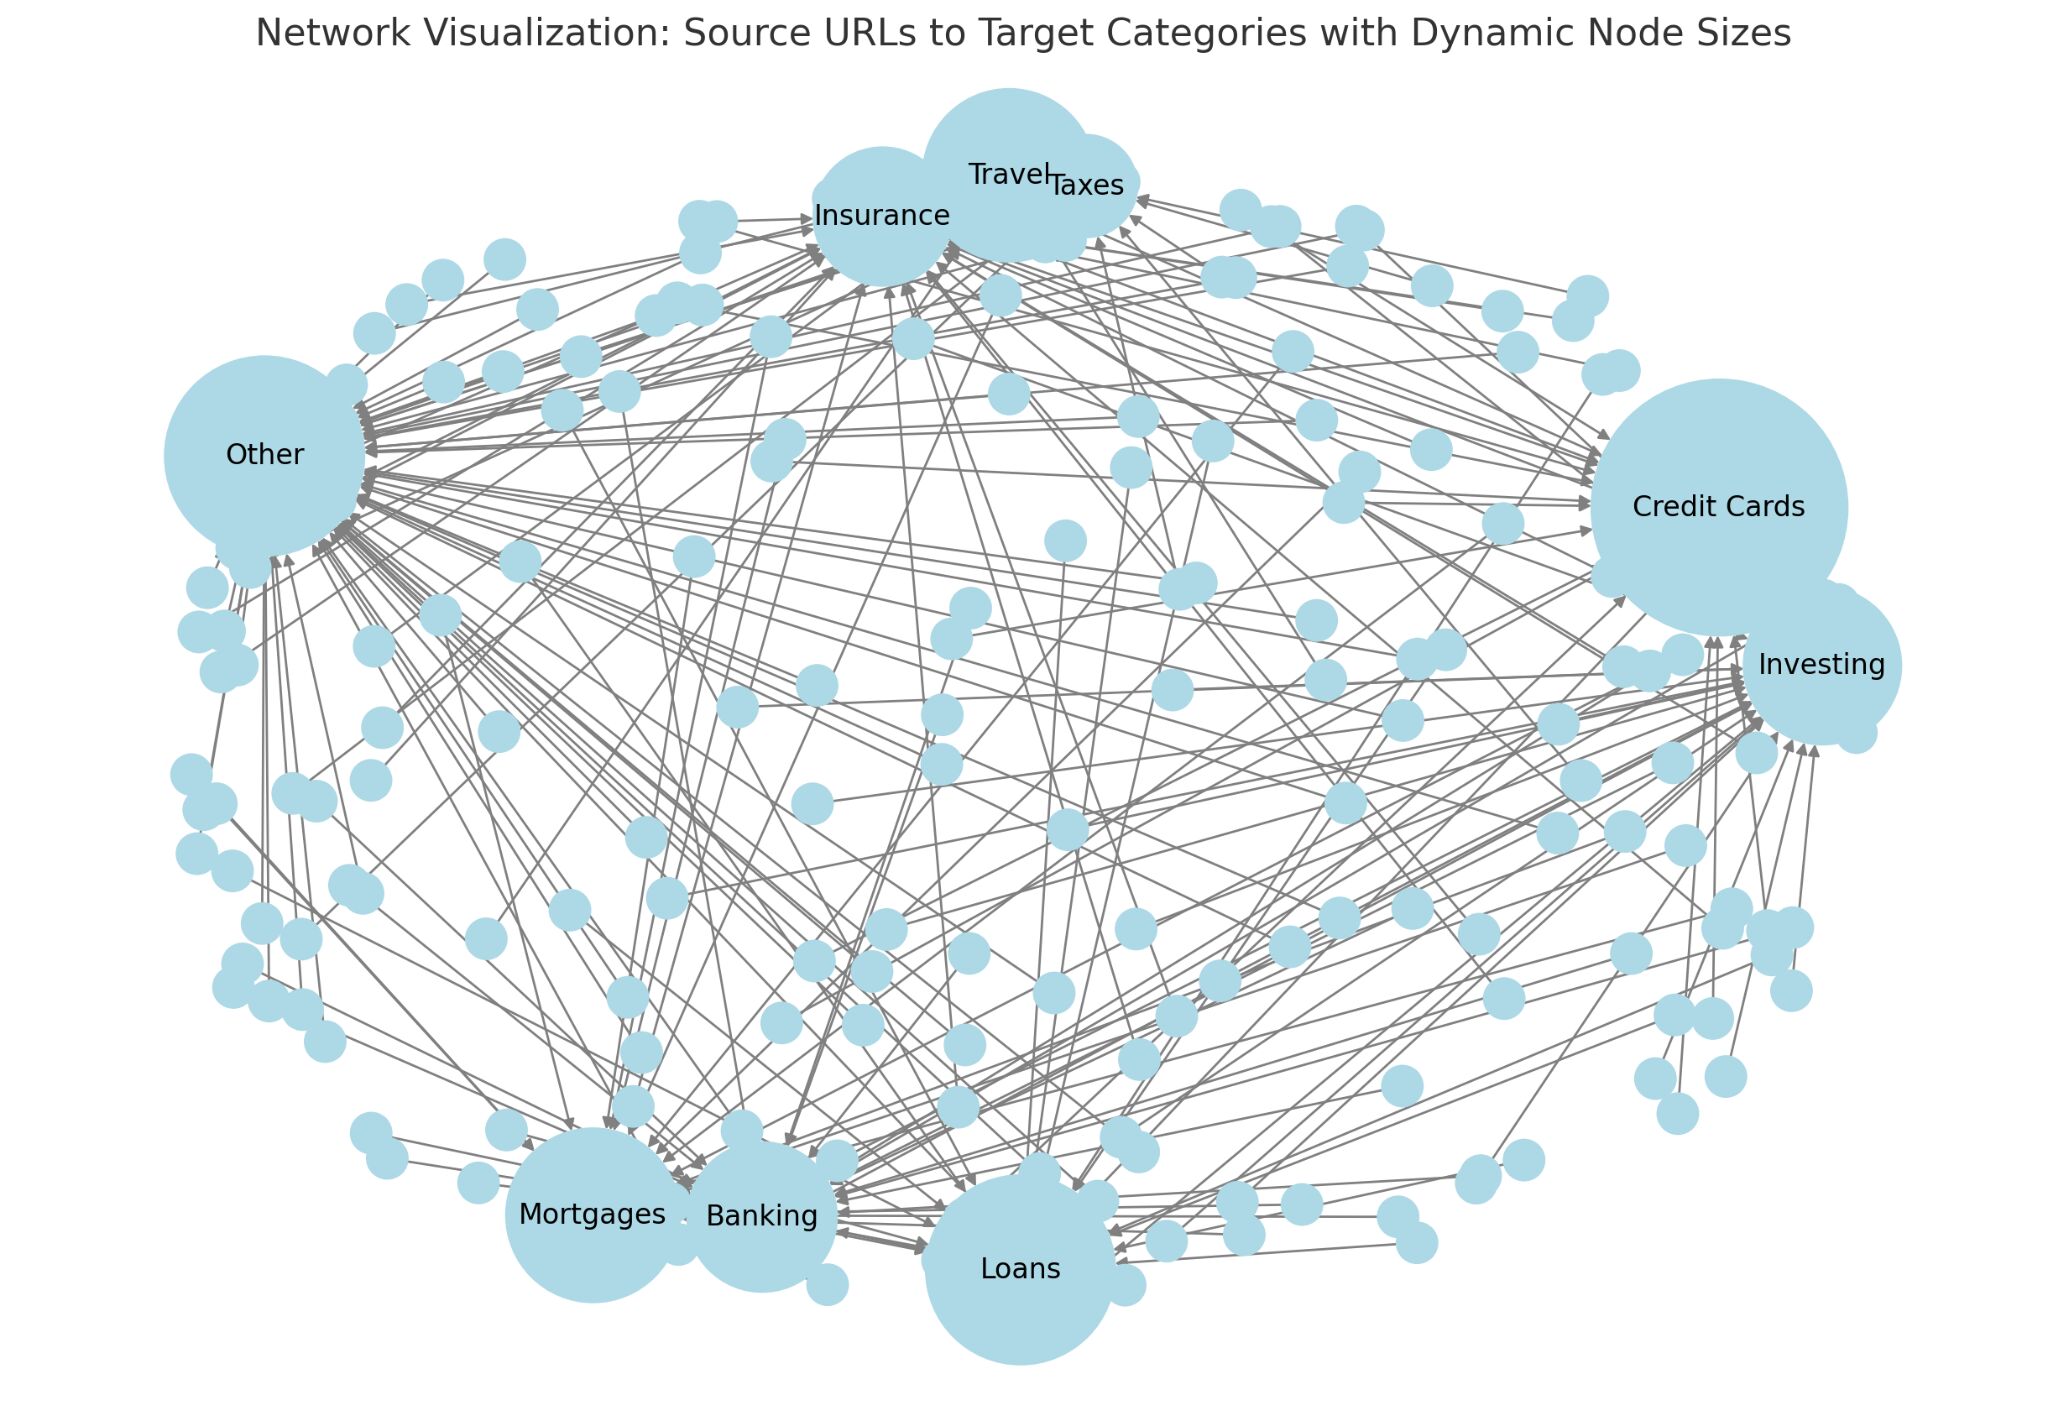
If you’re doing SEO for a site like NerdWallet, you need to know your redirects inside and out. That’s how they split 14k blog posts with 7M traffic into different topic clusters. One of the AIs drew me this fantastic visualization of how they split it. Redirects at NerdWallet deserves its own article.
Diminishing returns is a common phenomenon in content marketing. It’s when the incremental benefits of creating and publishing new content decrease over time despite the same or increased effort and resources being invested.
Here’s how diminishing returns in programmatic SEO look on a chart. Page count (blue line) goes dramatically up with no effect on the traffic (orange line).
Programmatic SEO is a smart tactic but also flawed by design. It treats keywords with the same structure in the same way. But in reality, each keyword will have a different difficulty. And with that typically comes someone’s effort in content and links that you’d need to beat.
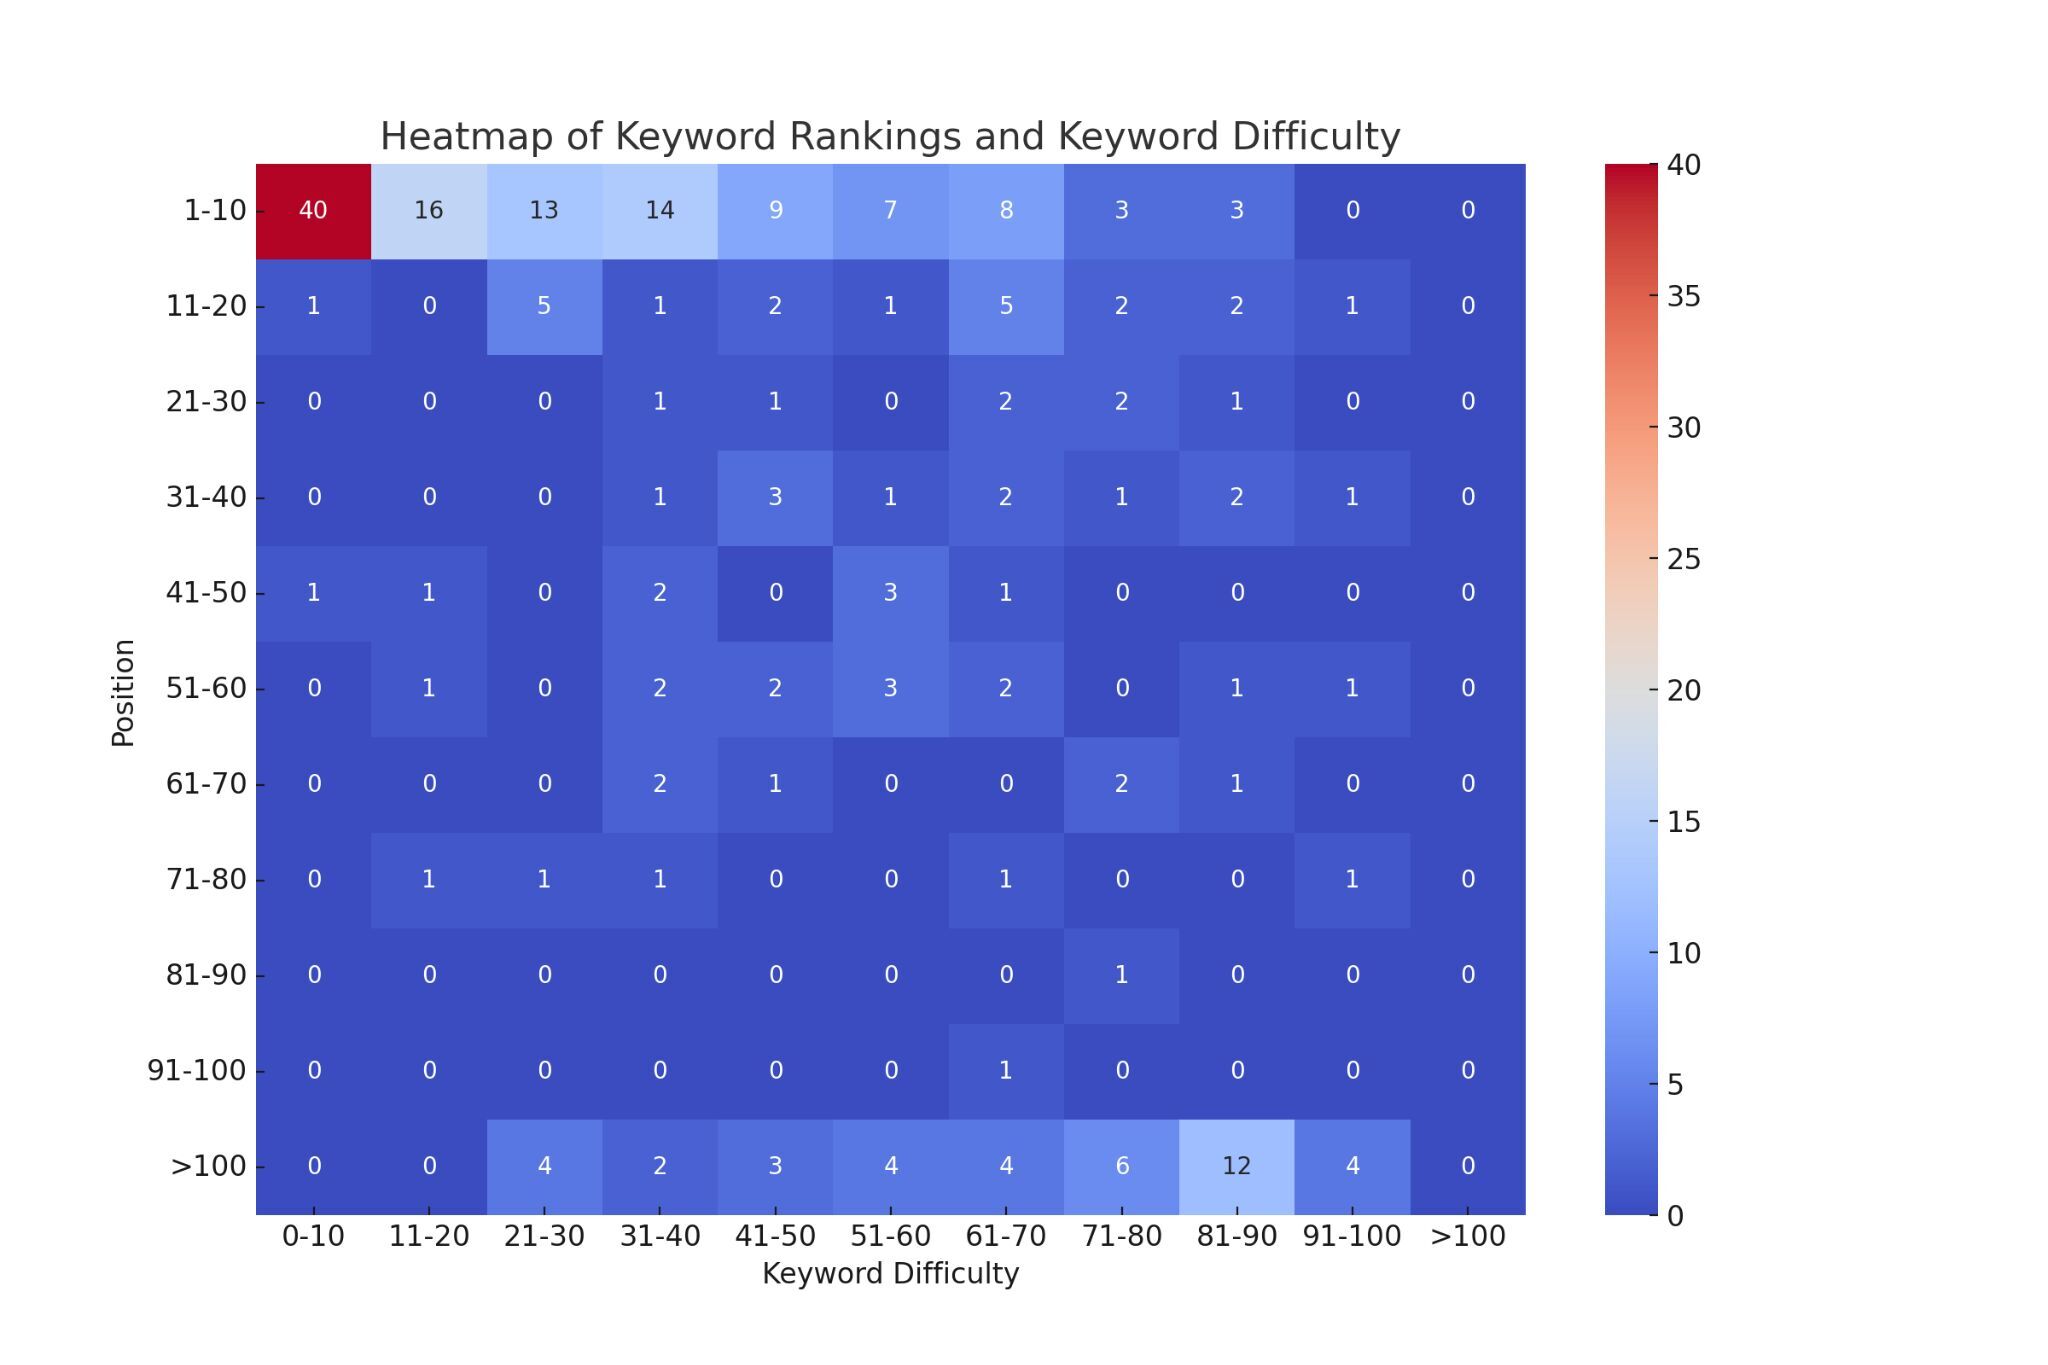
We observed this with one of our attempts at templated content. It worked for low-difficulty keywords (see chart below), but for other keywords, we needed to develop unique content.
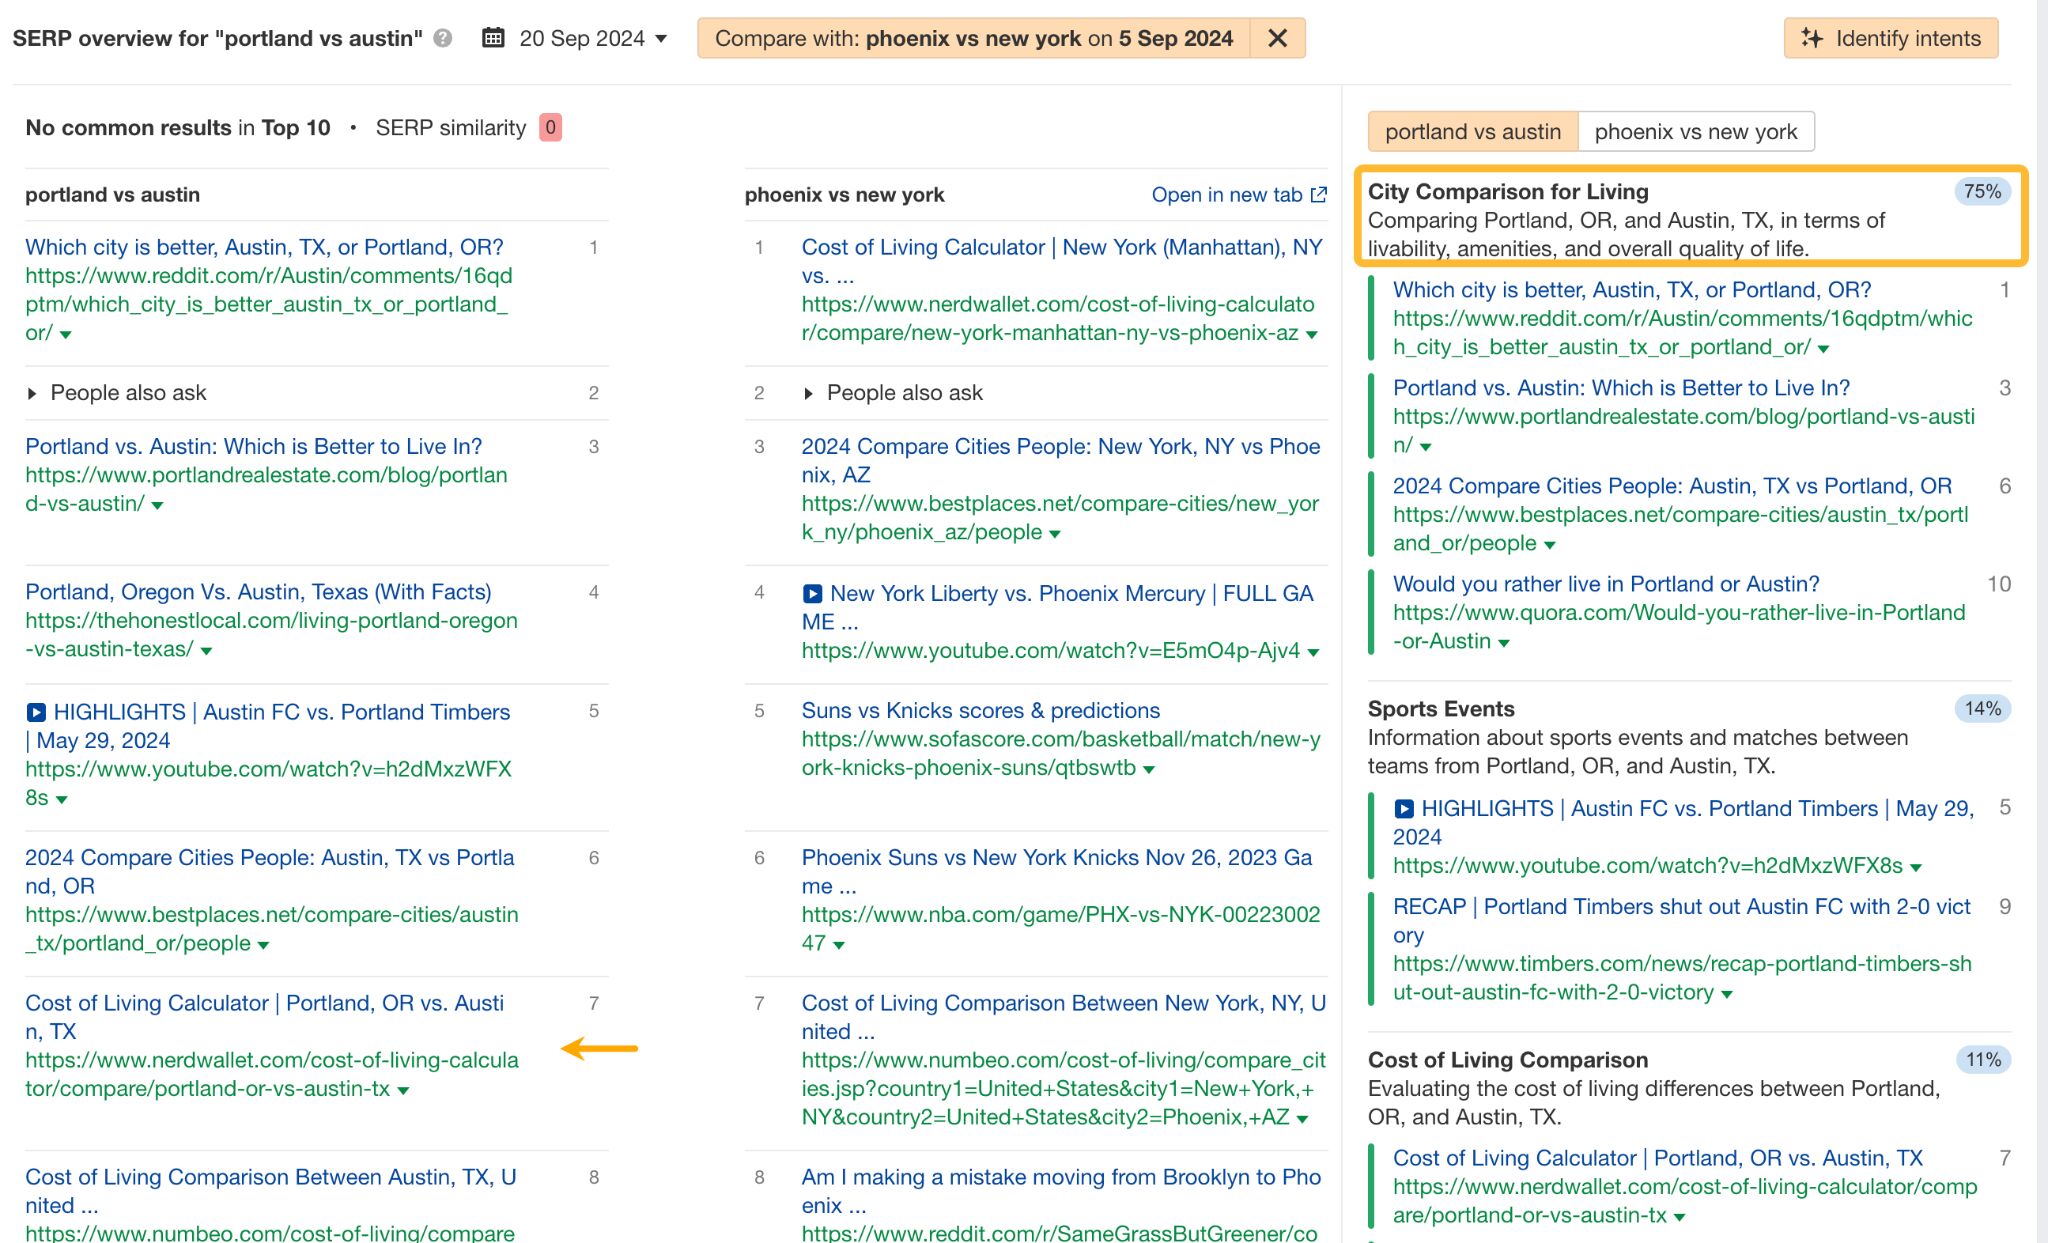
Keywords you’d be trying to target this way may even have different intent. For instance, “phoenix vs new york” has the cost of living as the primary intent, while a general city comparison is last. NerdWallet ranks #1.
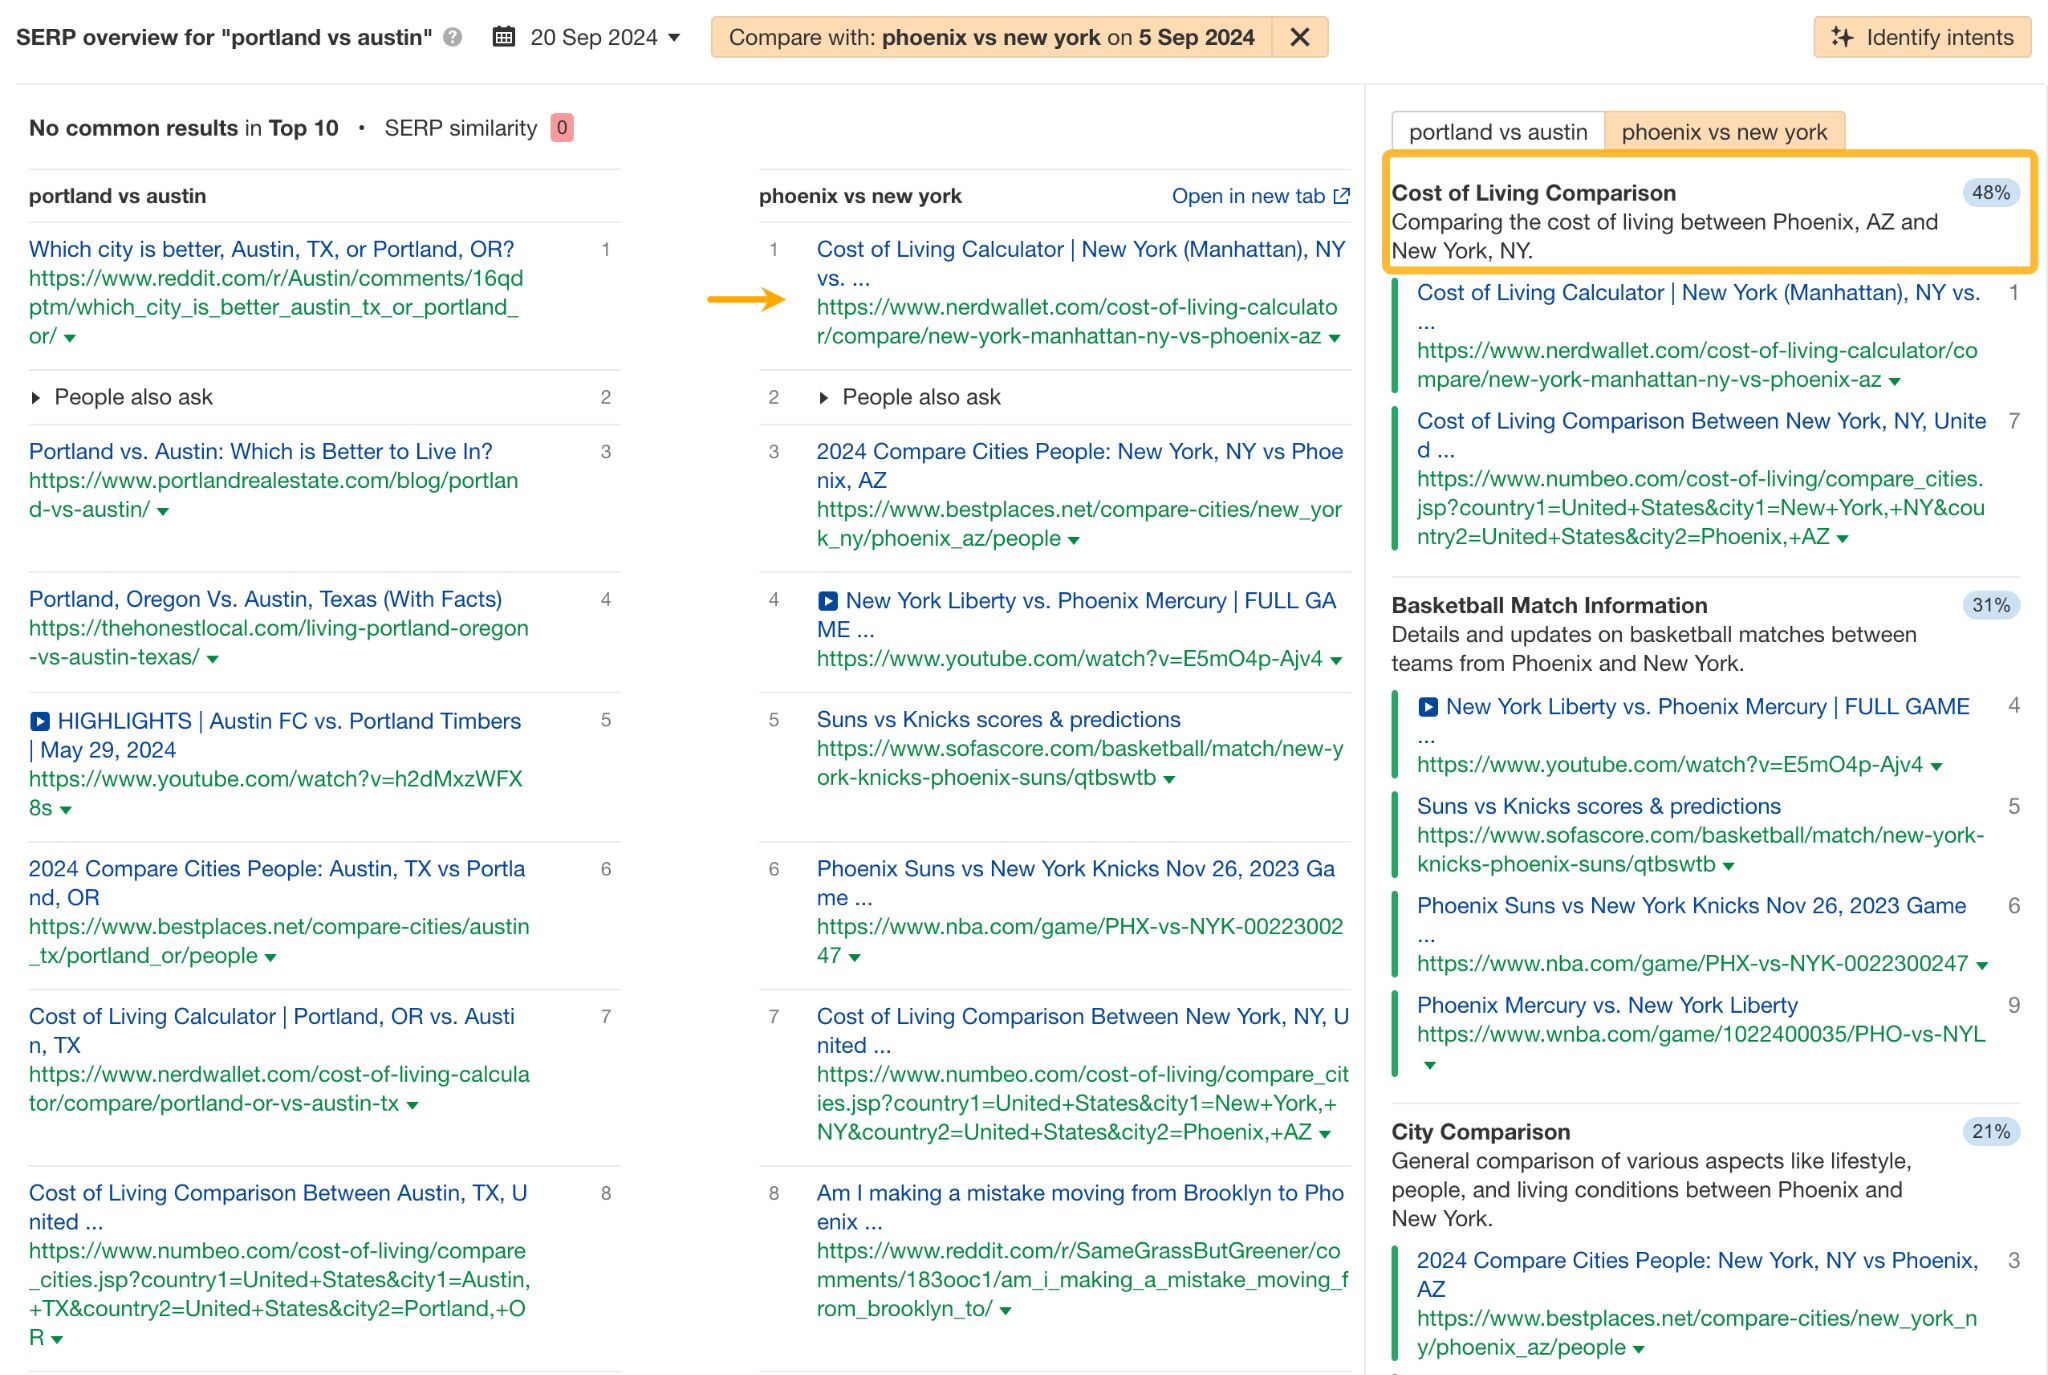
Conversely, “portland vs austin” is dominated by city comparison pages, and the cost of living is last. NerdWallet ranks #7 with the same programmatic tactic that gave it the top spot before.