I host nearly all the services I use on a bunch of Raspberry Pis and other hardware scattered across my little network.
From media servers to automation tools, it’s all there. But let me tell you, the more services you run, the more chaotic it gets. Trying to remember which server is running what, and keeping tabs on their status, can quickly turn into a nightmare.
That’s where dashboards come to the rescue. They’re not just eye candy; they’re sanity savers.
These handy tools bring everything together in one neat interface, so you know what’s running, where, and how it’s doing.
If you’re in the same boat, here’s a curated list of some excellent dashboards that can be the control center of your homelab.
Table of Contents
1. Homer
It’s essentially a static homepage that uses a simple YAML file for configuration. It’s lightweight, fast, and great for organizing bookmarks to your services.
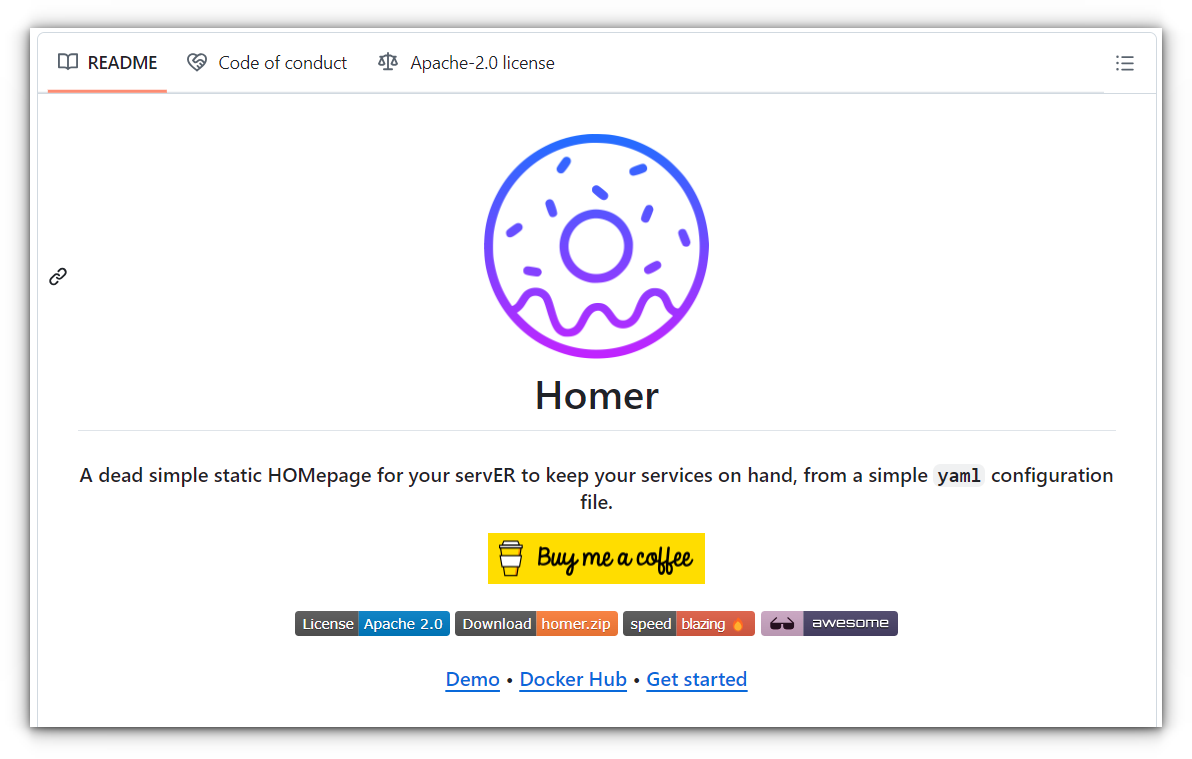
Customizing Homer is a breeze, with options for grouping services, applying themes, and even offline health checks. You can check out the demo yourself:

While it’s not as feature-rich as some of the other dashboards here, that’s part of its charm, it’s easy to set up and doesn’t bog you down with unnecessary complexity.
Deploy it using Docker, or just serve it from any web server. The downside? It’s too basic for those who want features like real-time monitoring or authentication.
✅ Easy YAML-based configuration, ideal for beginners.
✅ Lightweight and fast, with offline health checks for services.
✅ Supports theme customization and keyboard shortcuts.
❌ Limited to static links—lacks advanced monitoring or dynamic widgets.
2. Dashy
If you’re the kind of person who loves tinkering with every detail, Dashy will feel like a playground.
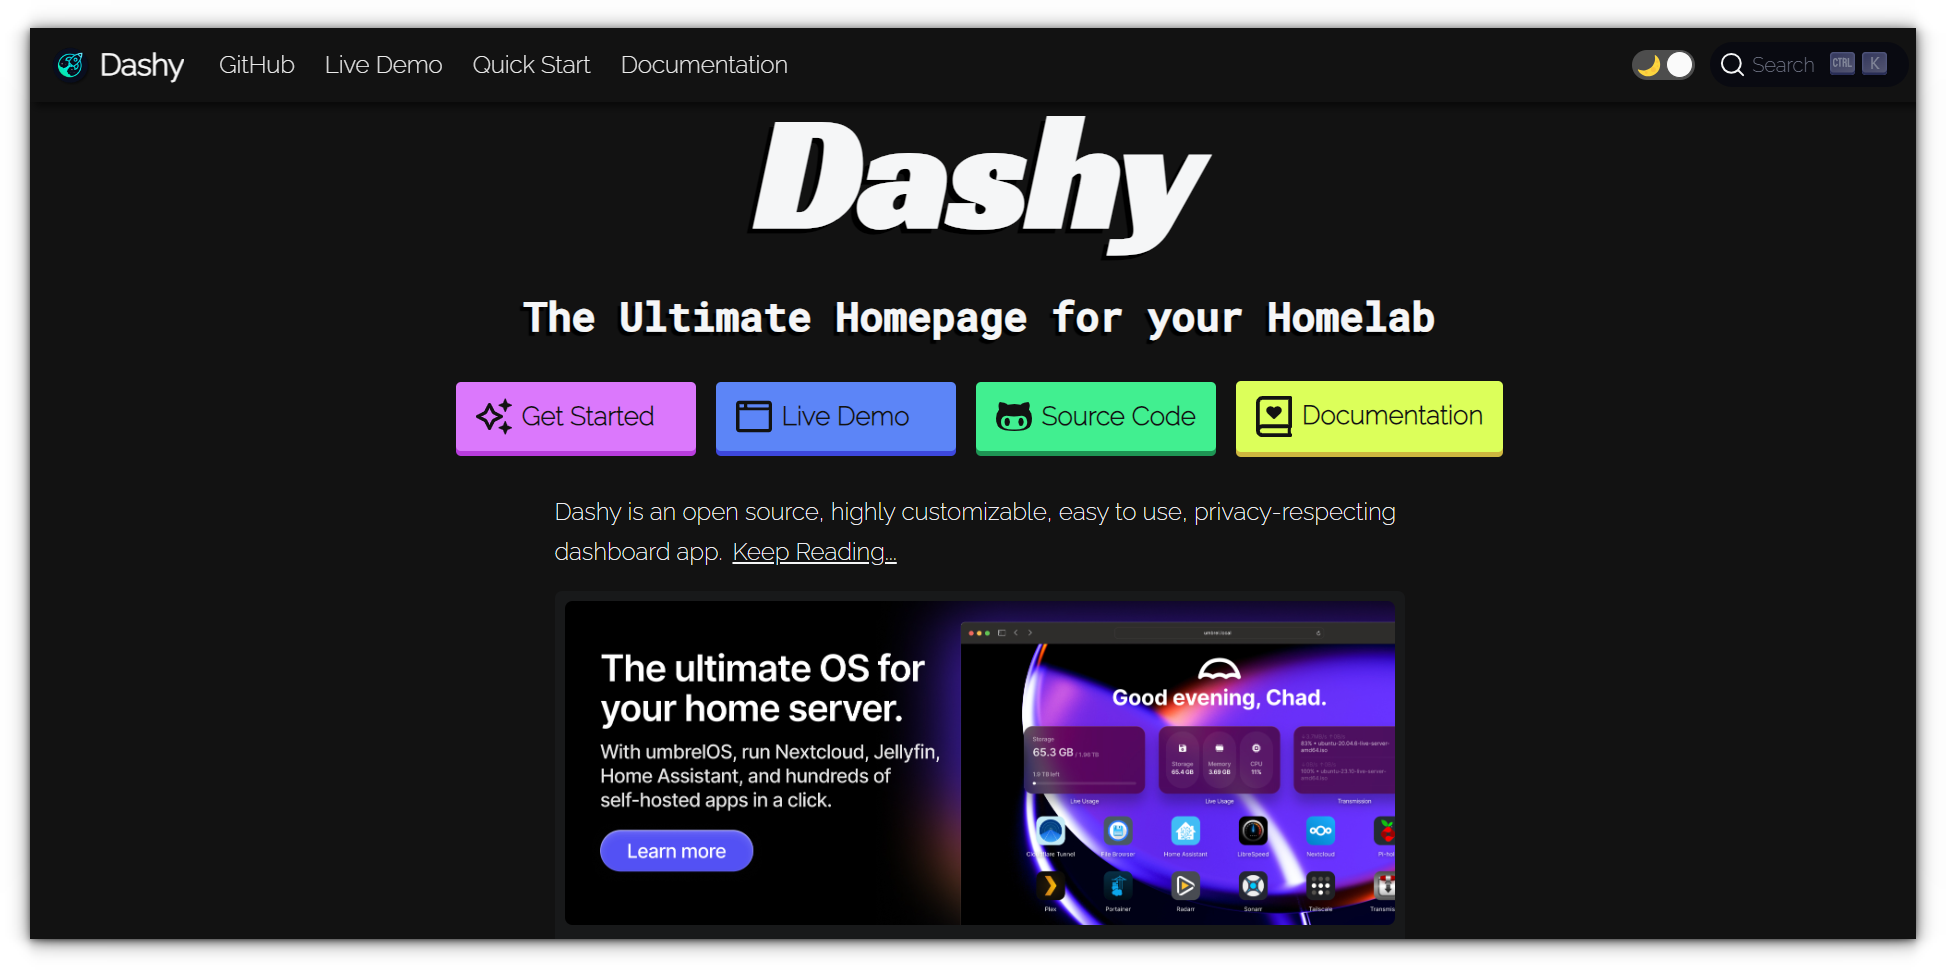
Its highly customizable interface lets you organize services, monitor their status, and even integrate widgets for extra functionality. Dashy supports multiple themes, custom icons, and dynamic content from your other tools.
You can check out the live demo of Dashy yourself:
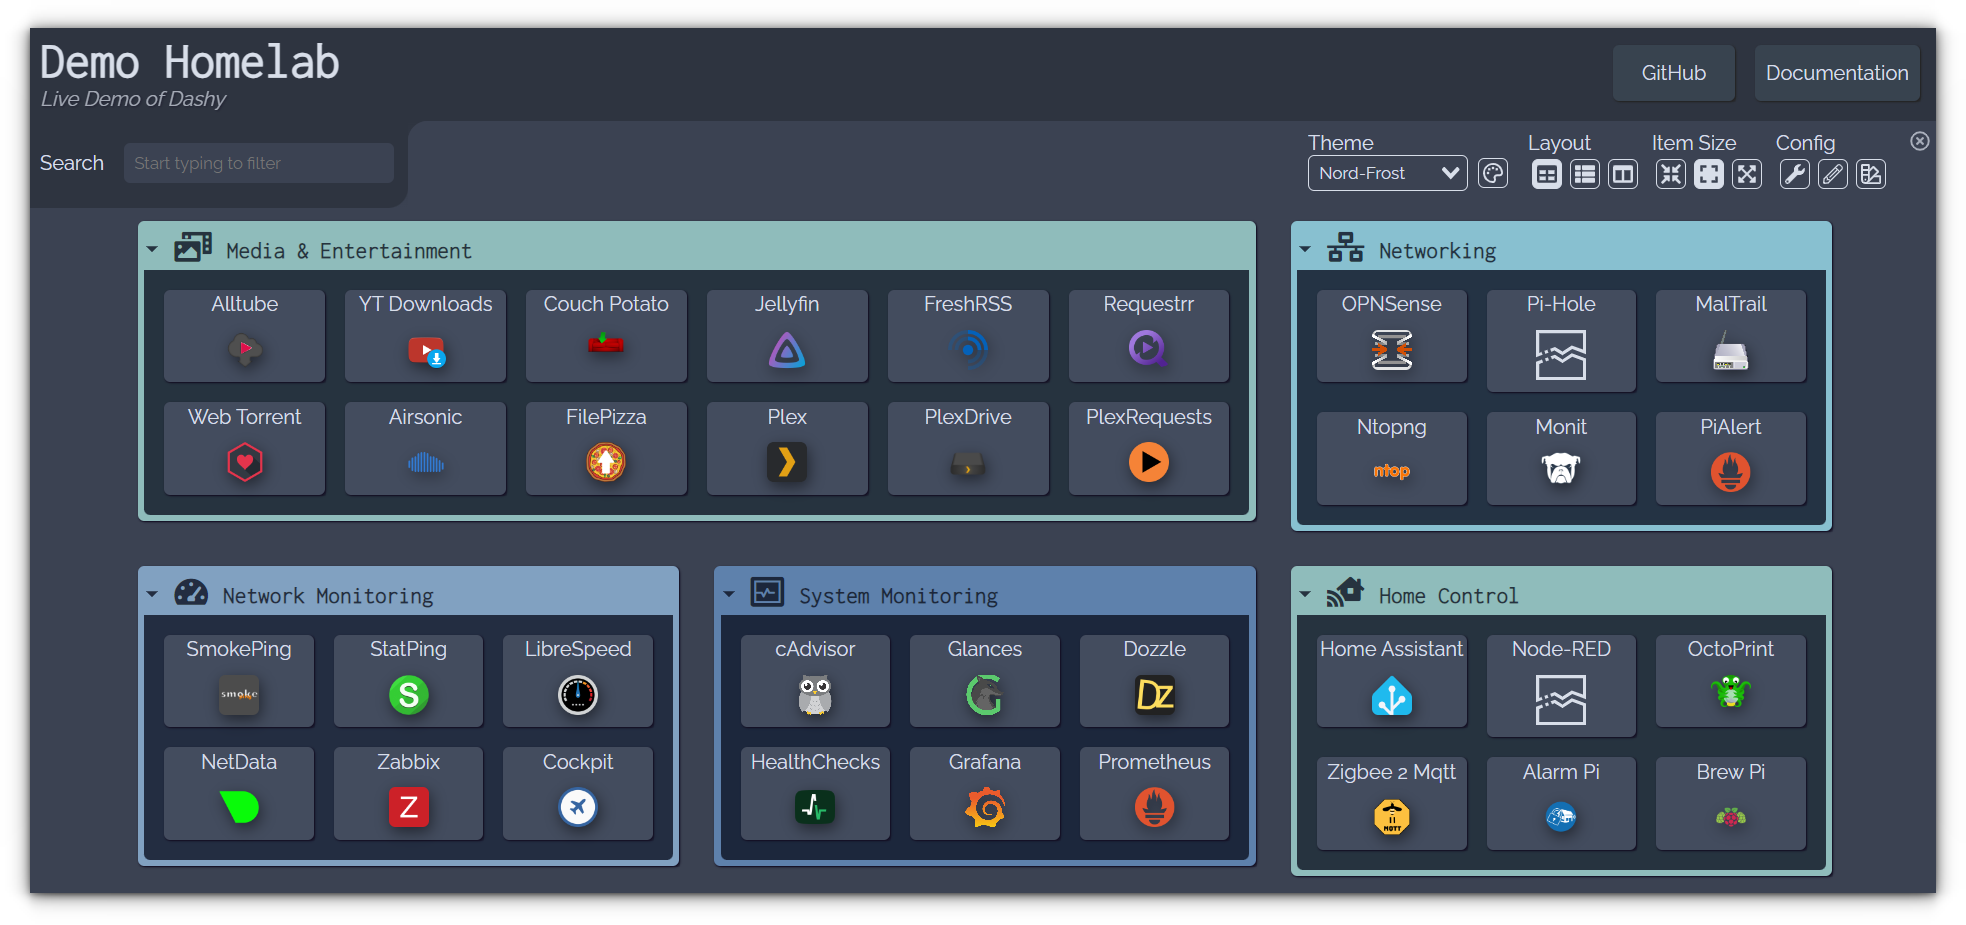
However, its extensive customization options can be overwhelming at first. It’s also more resource-intensive than simpler dashboards, but the trade-off is worth it for the sheer flexibility it offers. Install Dashy with Docker, or go bare metal if you’re feeling adventurous.
✅ Highly customizable with themes, layouts, and UI elements.
✅ Supports status monitoring and dynamic widgets for real-time updates.
✅ Easy setup via Docker, with YAML or GUI configuration options.
❌ Feature-heavy, which may feel overwhelming for users seeking simplicity.
❌ Can be resource-intensive on low-powered hardware.
3. Heimdall
Heimdall keeps things clean and simple while offering a touch of intelligence. You can add services with optional API integrations, enabling Heimdall to display real-time information like server stats or media progress.
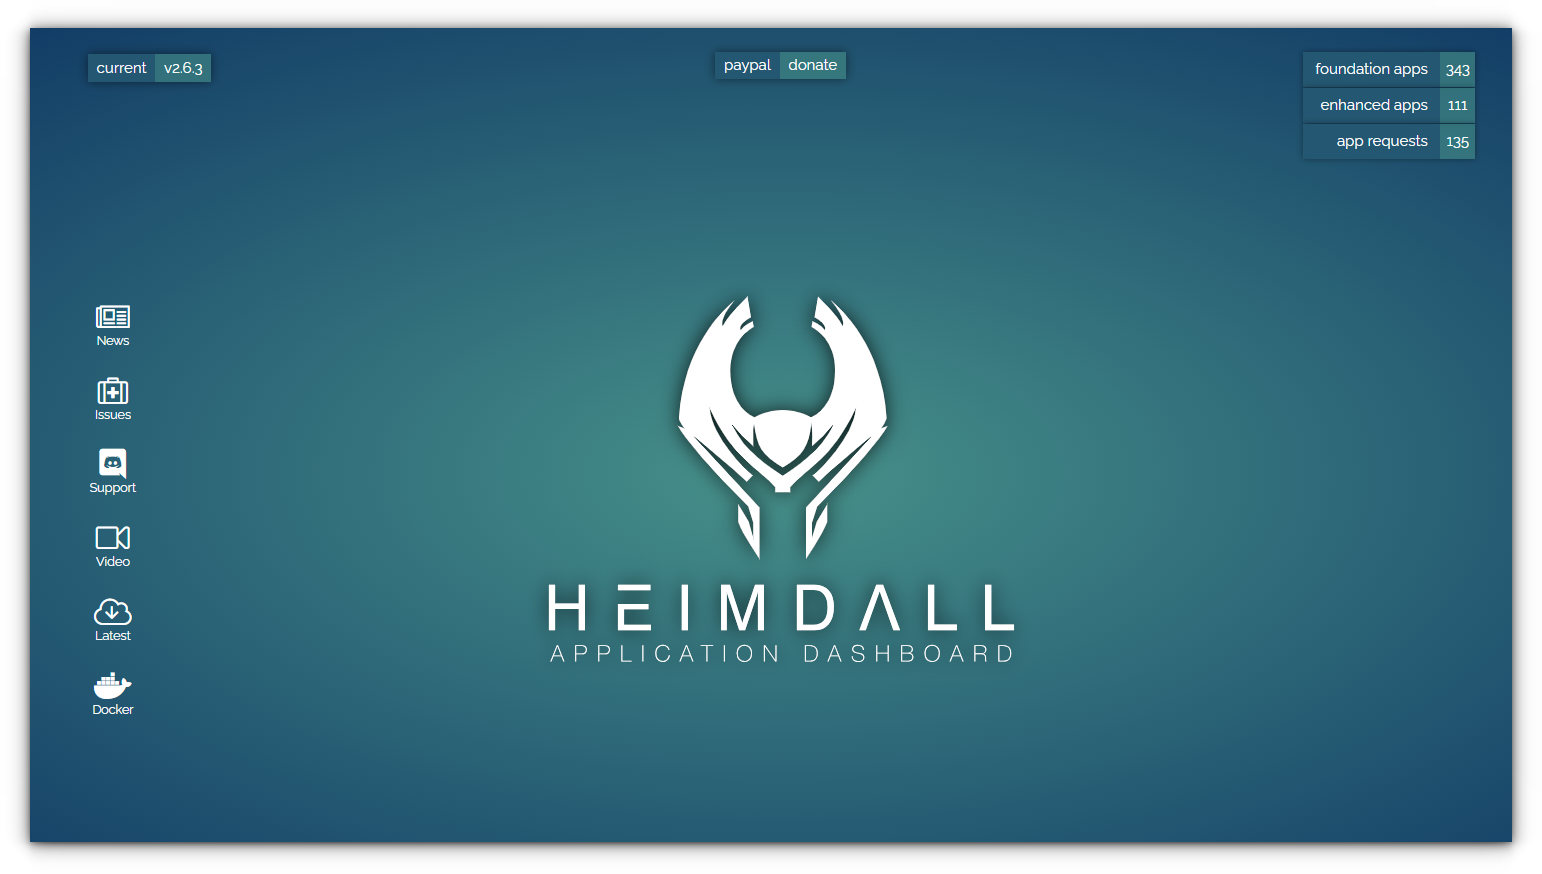
It doesn’t try to do everything, which makes it an excellent choice for those who just want an app launcher that works. It’s quick to set up, runs on Docker, and doesn’t demand much in terms of resources.
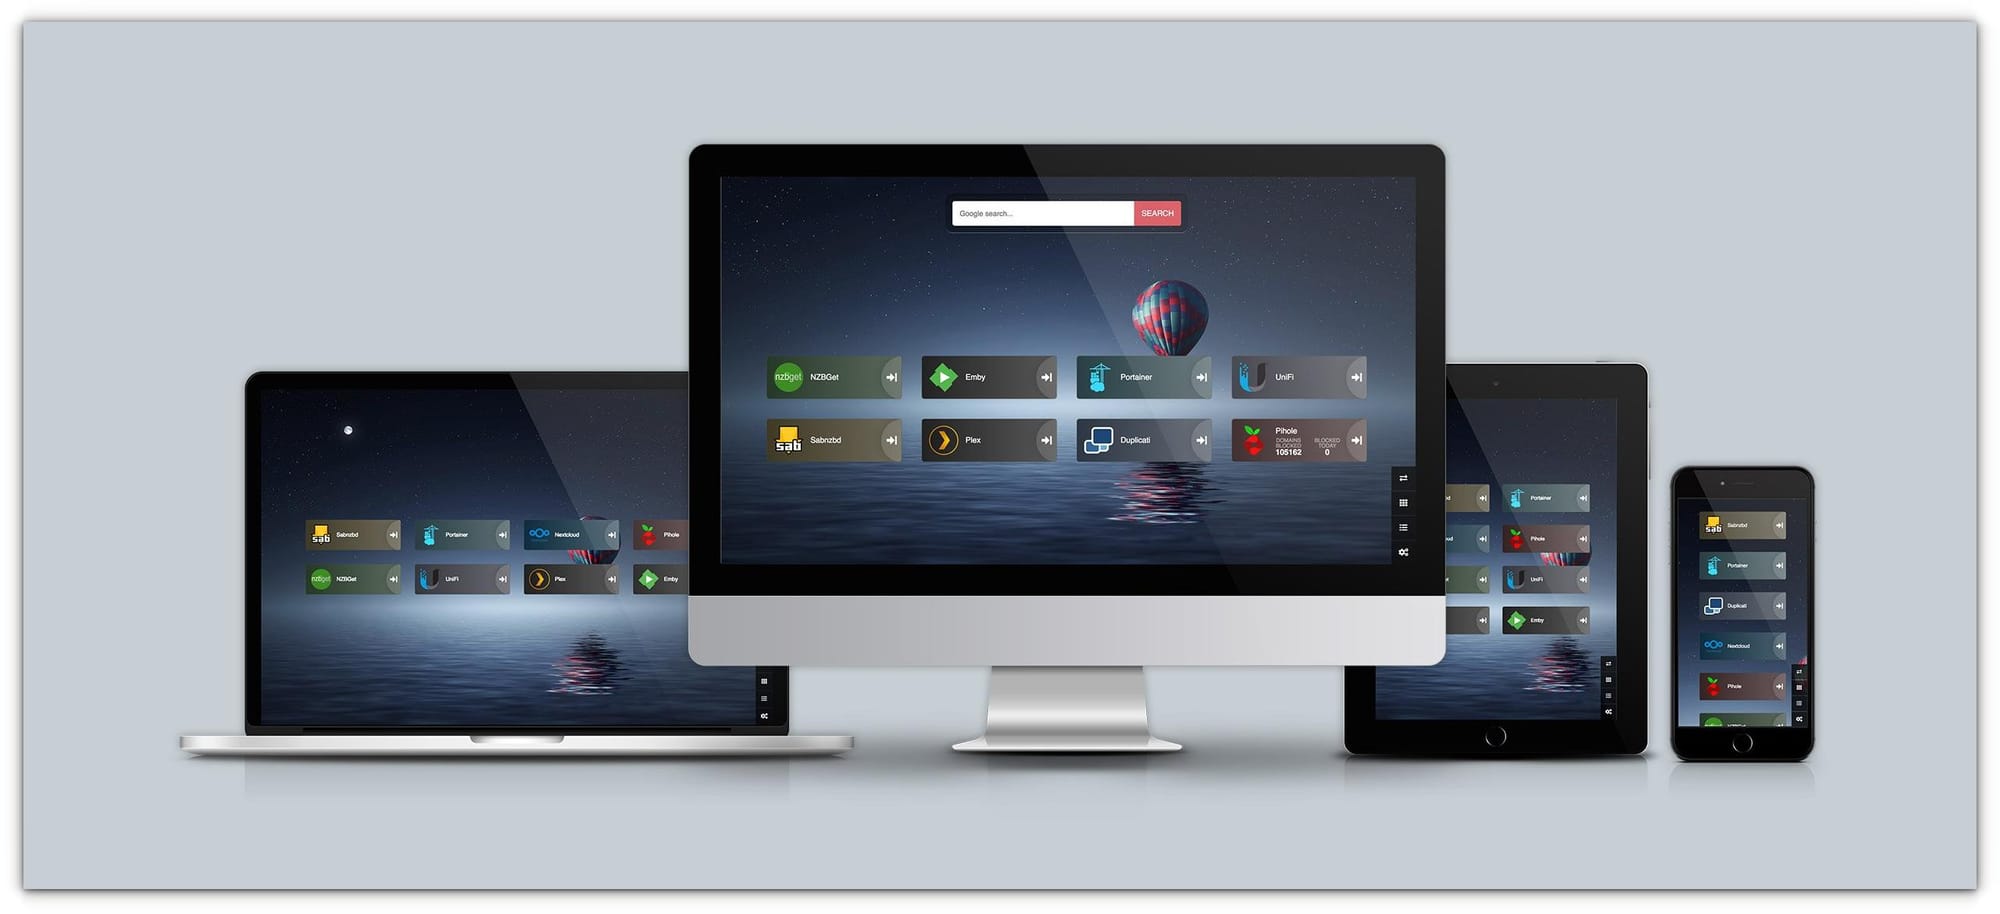
That said, the lack of advanced features like widgets or multi-user support might feel limiting for some.
✅ Clean and intuitive interface with support for dynamic API-based widgets.
✅ Straightforward installation via Docker or bare-metal setup.
✅ Highly extensible, with the ability to add links to non-application services.
❌ Limited customization compared to Dashy or Organizr.
❌ No built-in user authentication or multi-user support.
4. Organizr
Organizr is like a Swiss Army knife for homelab enthusiasts. It’s more than a dashboard, it’s a full-fledged service organizer that lets you manage multiple applications within a single web interface.
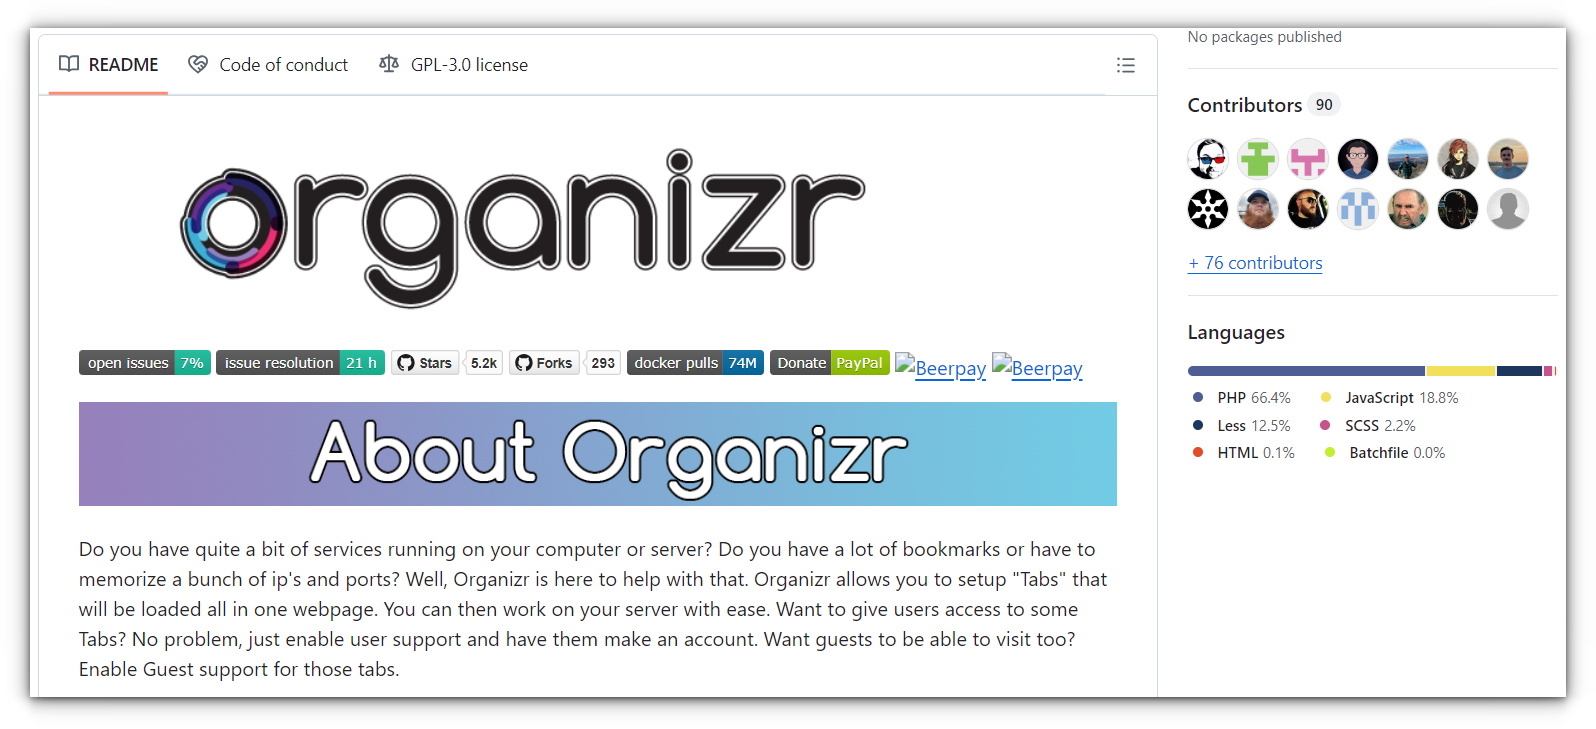
Tabs are the core of Organizr, allowing you to categorize and access services with ease. You can experiment yourself with their demo website.
It also supports multi-user environments, guest access, and integration with tools like Plex or Emby.
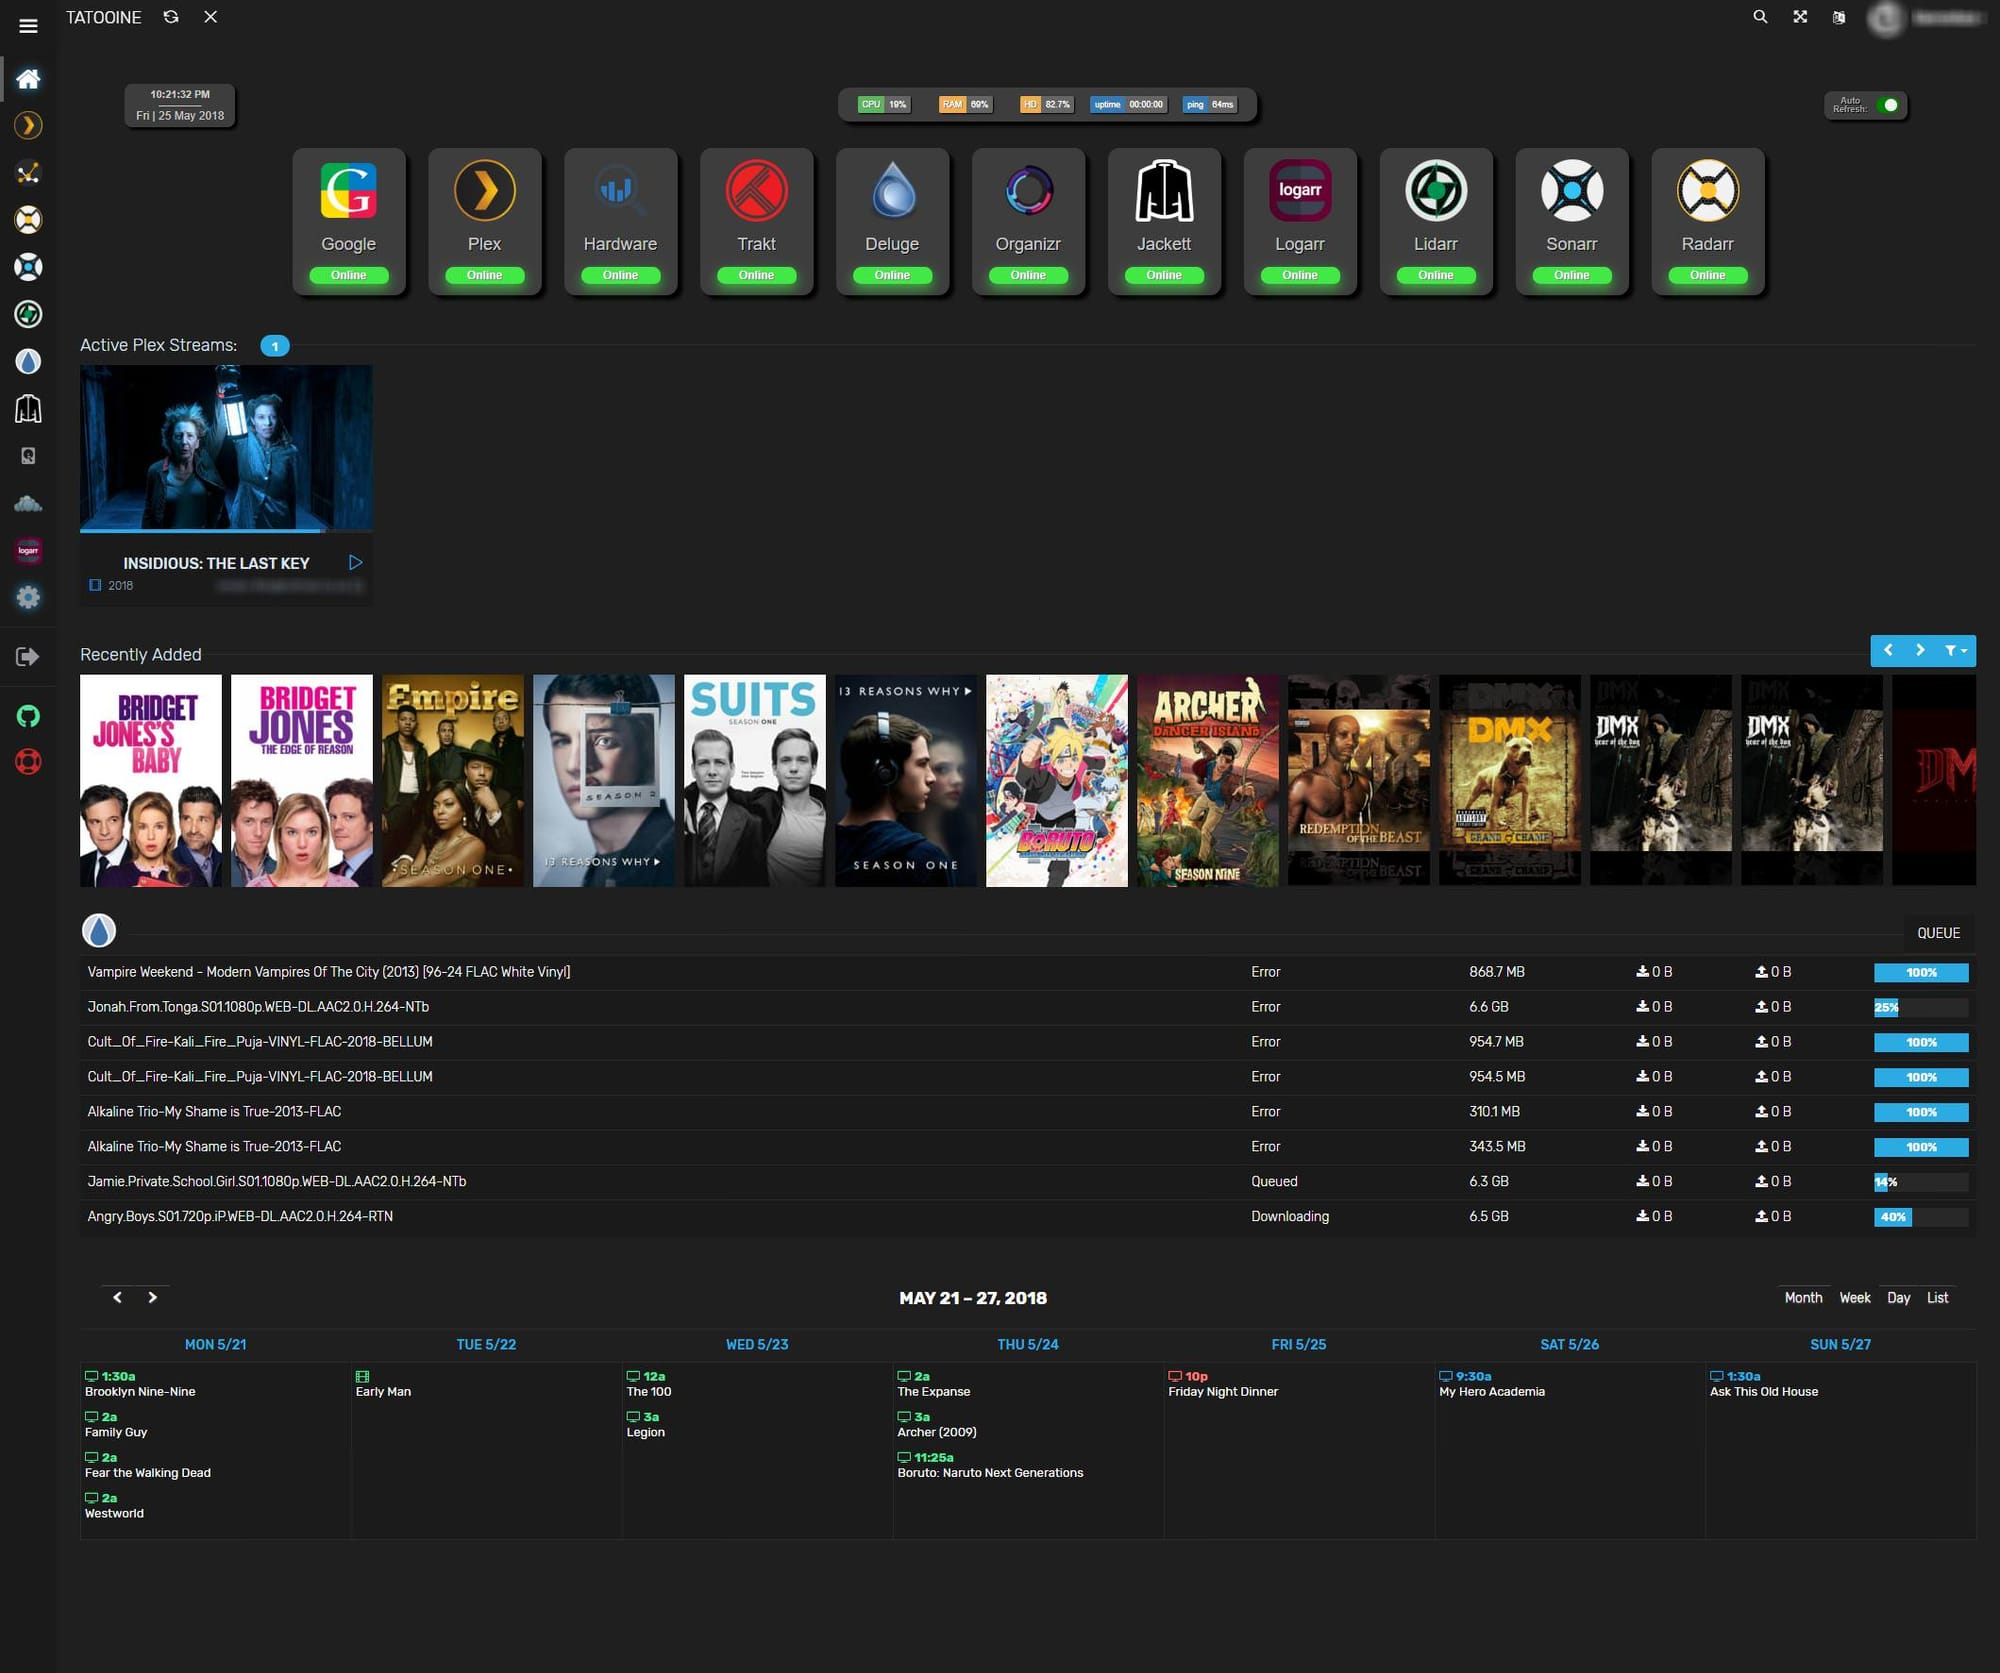
Setting it up requires some work, as it’s PHP-based, but once you’re up and running, it’s an incredibly powerful tool.
The downside? It’s resource-heavy and overkill if you’re just looking for a simple homepage.
✅ Tab-based interface with support for custom tabs and user access control.
✅ Extensive customization options for themes and layouts.
✅ Multi-user and guest access support with user group management.
❌ Setup can be complex for first-time users, especially on bare metal.
❌ Interface may feel cluttered if too many tabs are added.
5. Umbrel
Umbrel is more like a platform, since they offer their own umbrelOS and devices like Umbrel Home. Initially built for running Bitcoin and Lightning nodes, Umbrel has grown into a robust self-hosting environment.
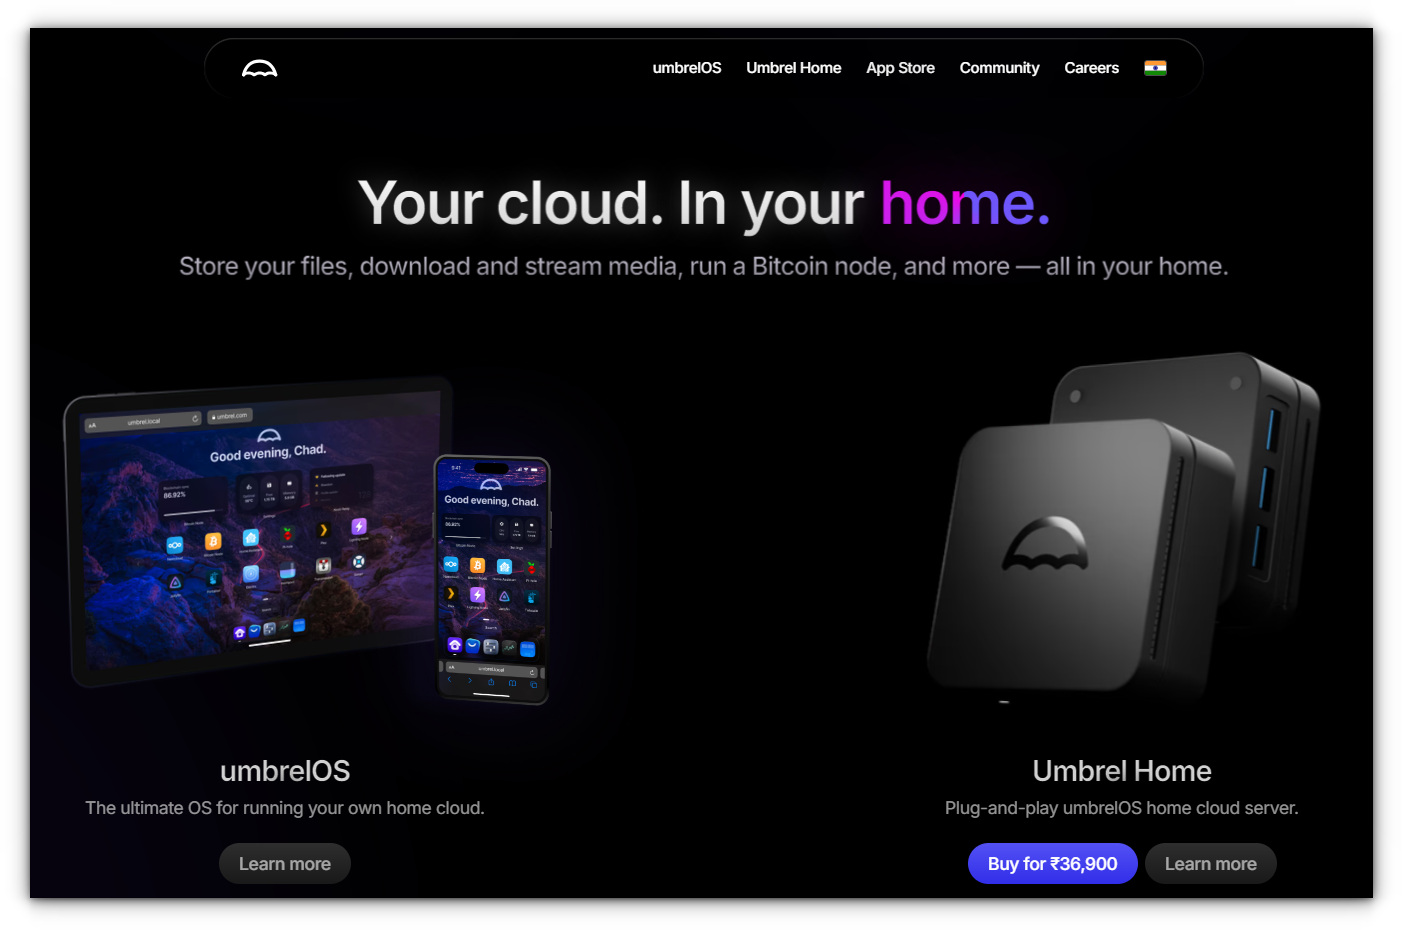
It offers a slick interface and an app store where you can one-click install tools like Nextcloud, Home Assistant, or Jellyfin, making it perfect for beginners or anyone wanting a “plug-and-play” homelab experience.
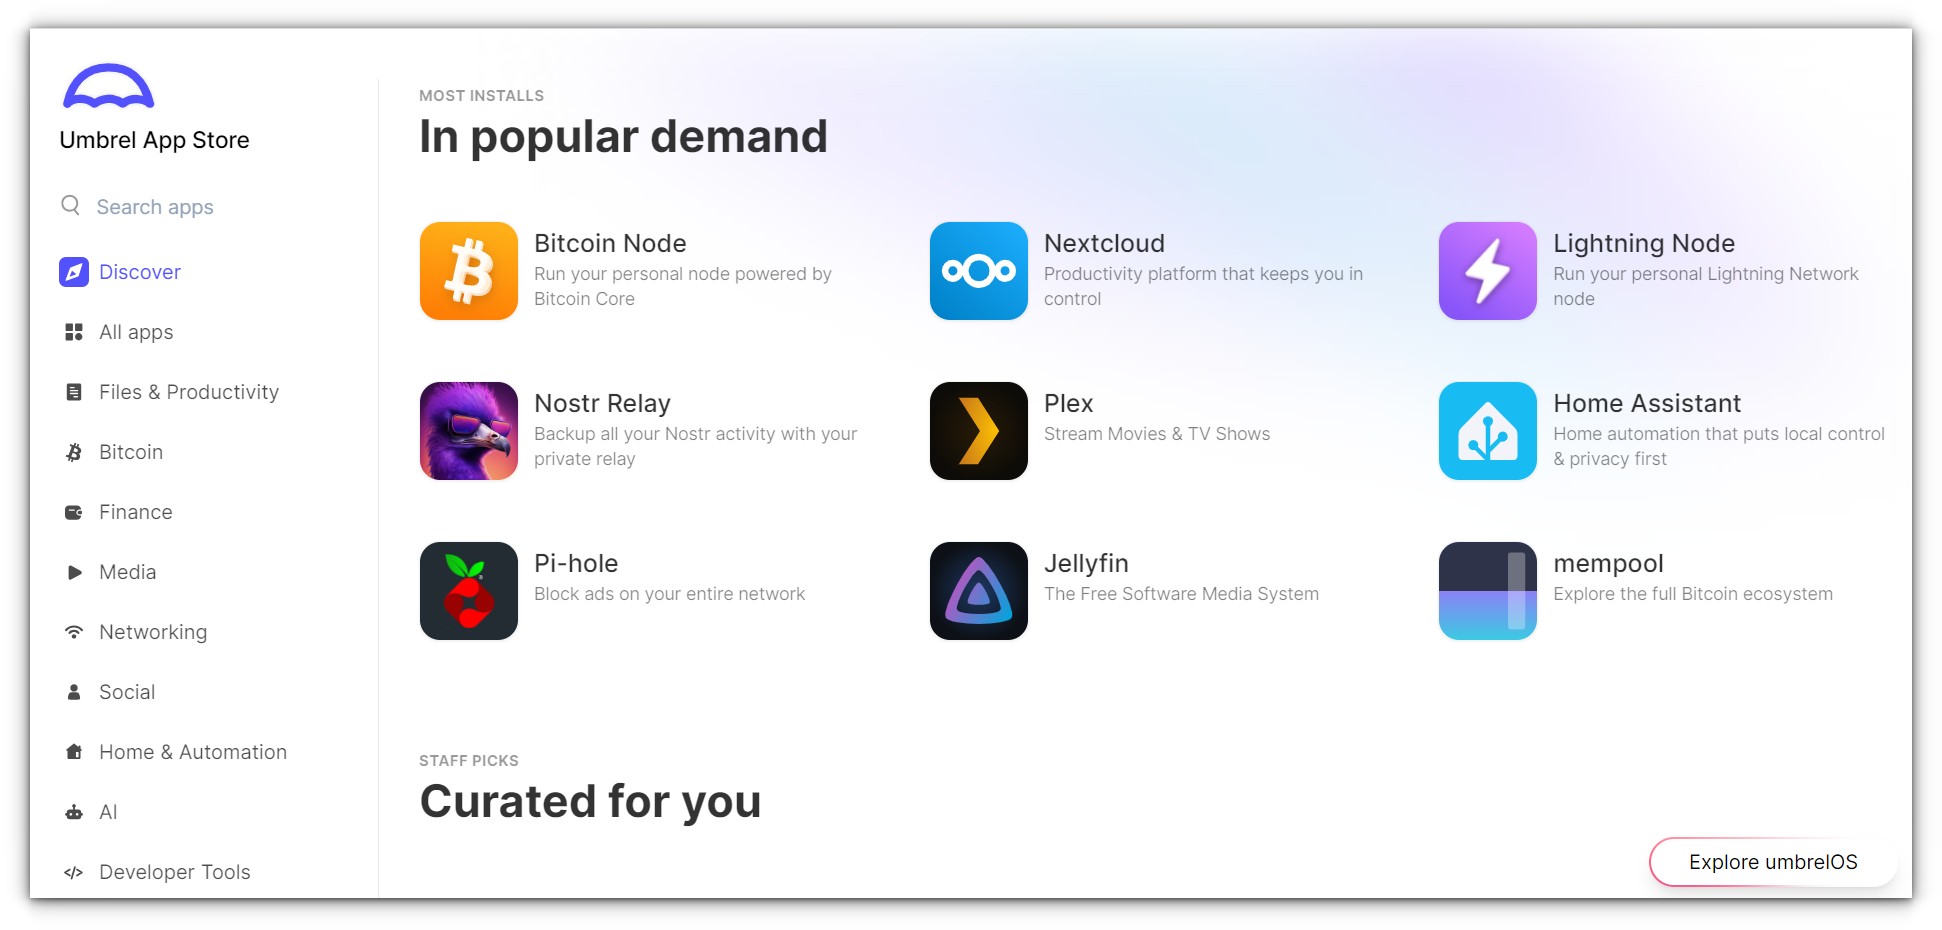
The user interface is incredibly polished, with a design that feels like it belongs on a consumer-grade device (Umbrel Home) rather than a DIY server.
While it’s heavily focused on ease of use, it’s also open-source and completely customizable for advanced users.
The only downside? It’s not as lightweight as some of the simpler dashboards, and power users might feel limited by its curated ecosystem.
✅ One-click app installation with a curated app store.
✅ Optimized for Raspberry Pi and other low-powered devices.
✅ User-friendly interface with minimal setup requirements.
❌ Limited to the apps available in its ecosystem.
❌ Less customizable compared to other dashboards like Dashy.
6. Flame
Flame walks a fine line between simplicity and functionality. It gives you a modern start page for your server, where you can manage bookmarks, applications, and even Docker containers with ease.
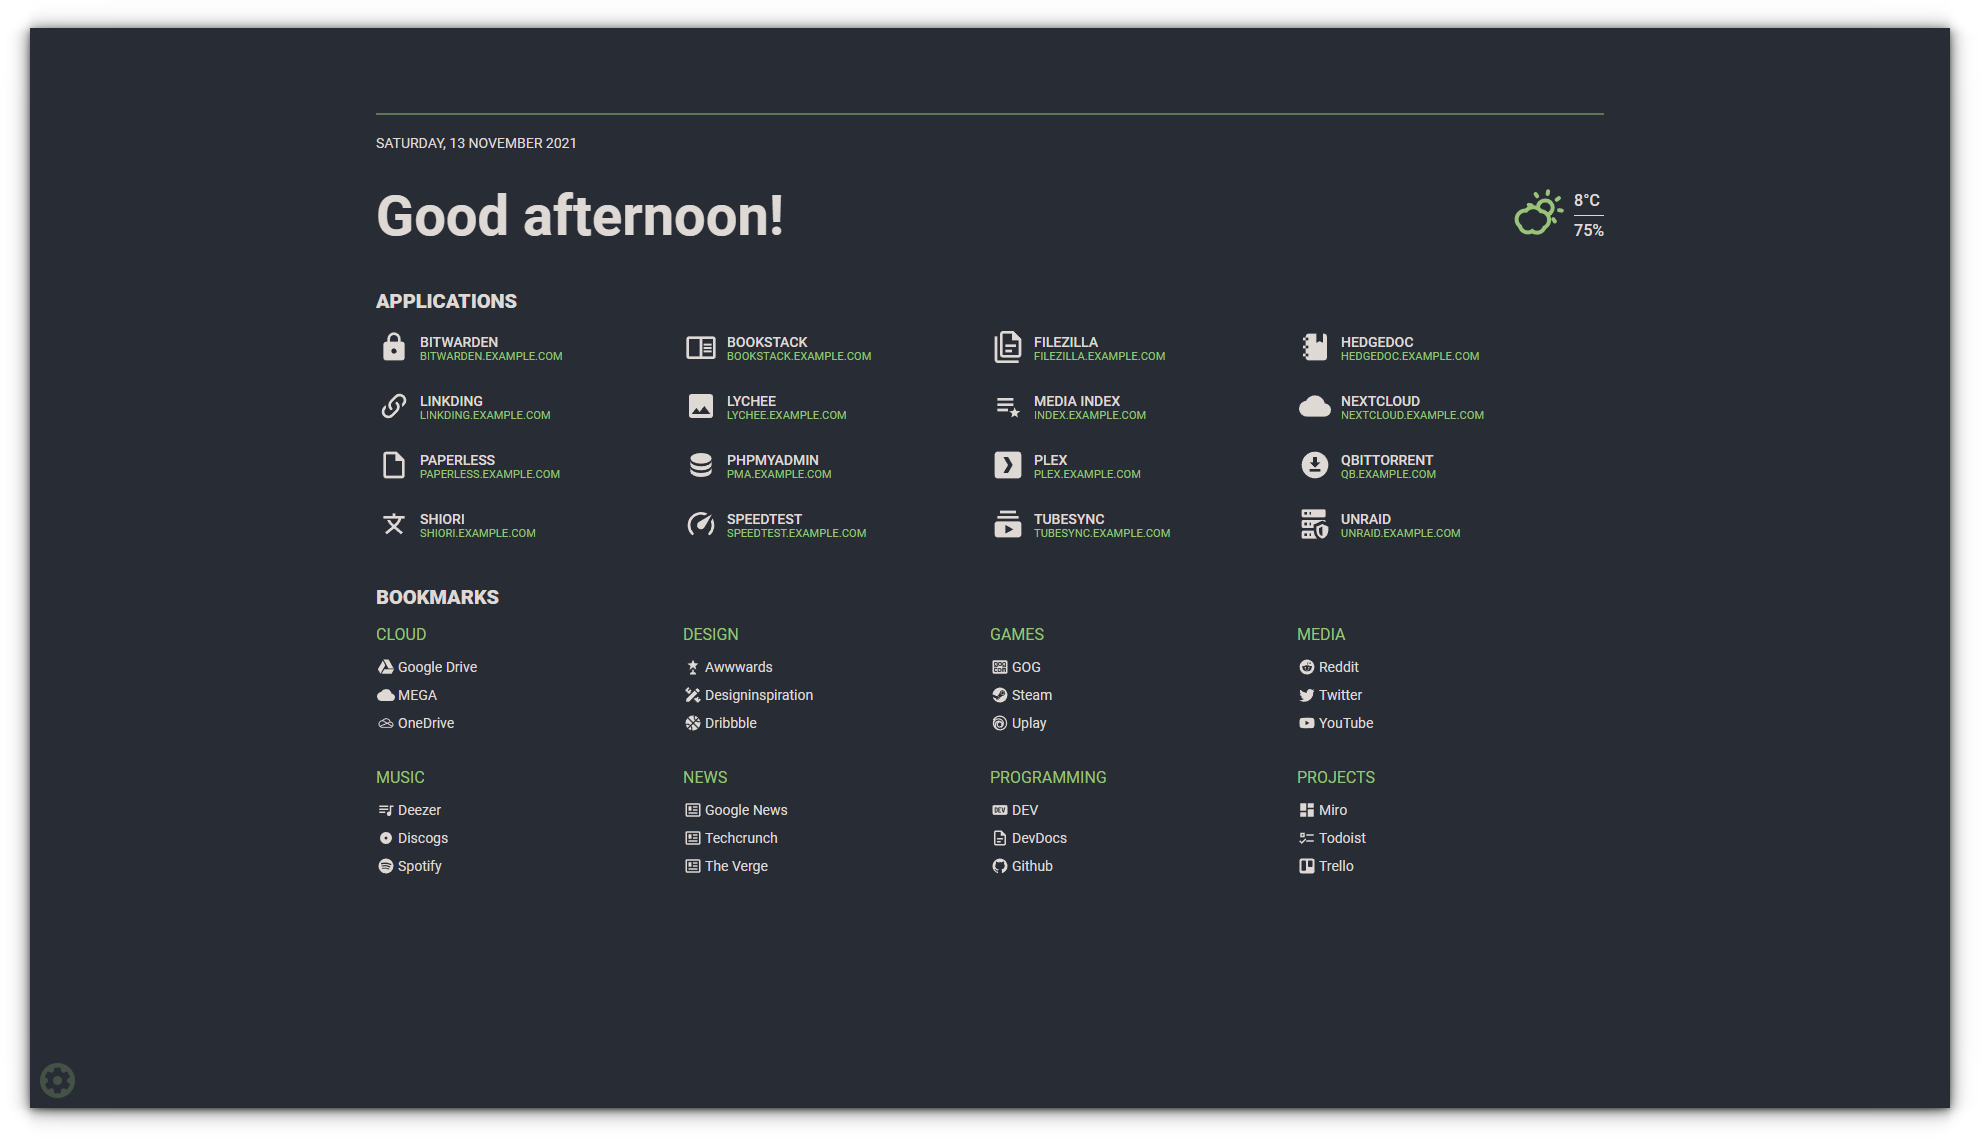
The built-in GUI editor is fantastic for creating and editing bookmarks without touching a single file.
Plus, the ability to pin your favorites, customize themes, and add a weather widget makes Flame feel personal and interactive.
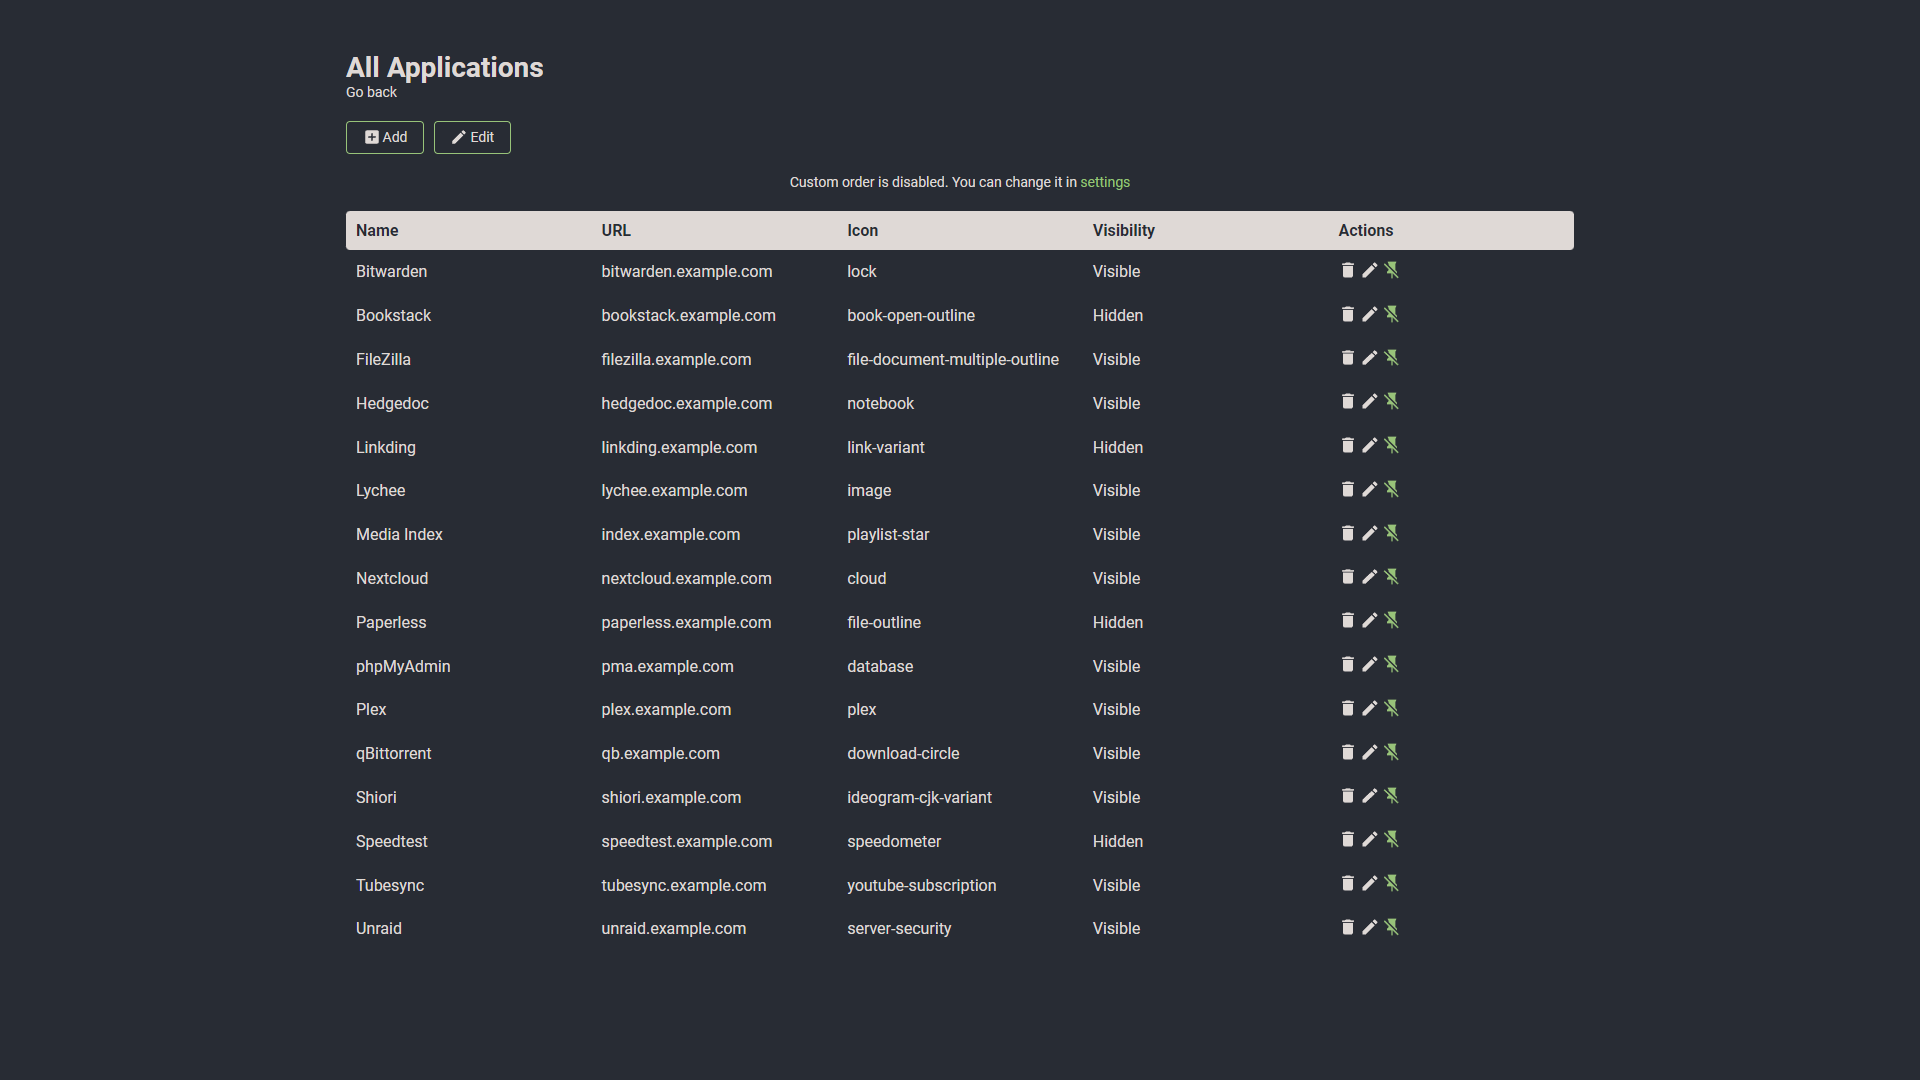
However, it lacks advanced monitoring features, so if you’re looking for detailed stats on your services, this might not be the right fit.
Installing Flame is as simple as pulling a Docker image or cloning its GitHub repository.
✅ Built-in GUI editors for creating, updating, and deleting applications and bookmarks.
✅ Supports pinning favorites, local search, and weather widgets.
✅ Easy Docker-based setup with minimal configuration required.
❌ Limited dynamic features compared to Dashy or Heimdall.
❌ Lacks advanced monitoring or user authentication features.
7. UCS Server (Univention Corporate Server)
If your homelab leans towards enterprise-grade capabilities, UCS Server is worth exploring.
It’s more than just a dashboard, it’s a full-fledged server management system with integrated identity and access management.

UCS is especially appealing for those running hybrid setups that mix self-hosted services with external cloud environments.
Its intuitive web interface simplifies the management of users, permissions, and services. Plus, it supports Docker containers and virtual machines, making it a versatile choice.
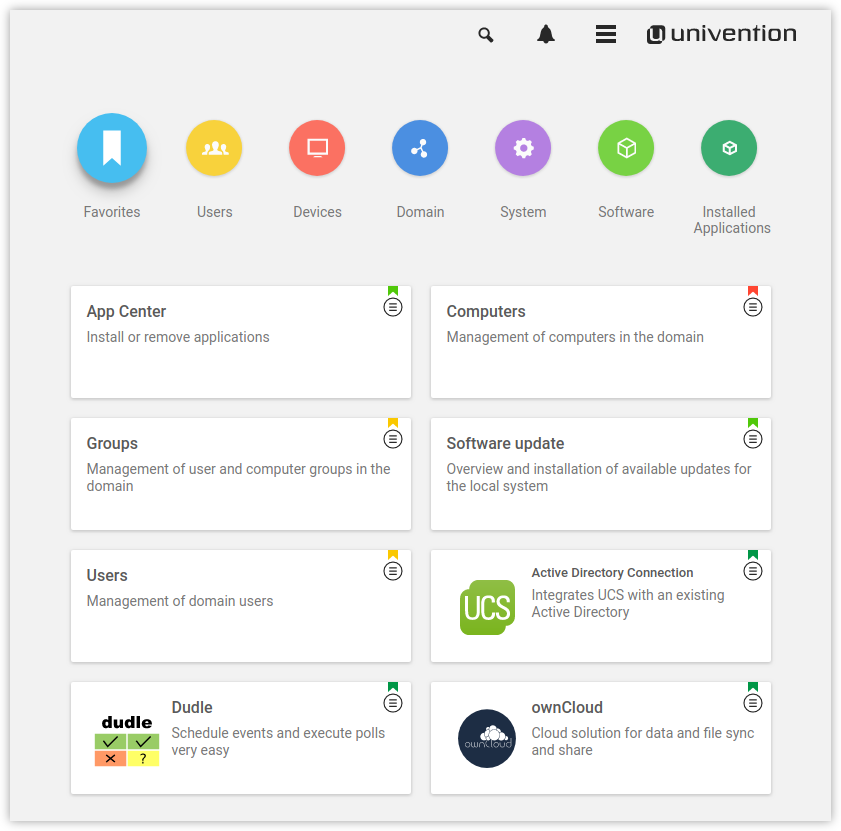
The learning curve is steeper compared to more minimal dashboards like Homer or Heimdall, but it’s rewarding if you’re managing a complex environment.
Setting it up involves downloading the ISO, installing it on your preferred hardware or virtual machine, and then diving into its modular app ecosystem.
One drawback is its resource intensity, this isn’t something you’ll run comfortably on a Raspberry Pi. It’s best suited for those with dedicated homelab hardware.
✅ Enterprise-grade solution with robust user and service management.
✅ Supports LDAP integration and multi-server setups.
✅ Extensive app catalog for deploying various services.
❌ Overkill for smaller homelabs or basic setups.
❌ Requires more resources and knowledge to configure effectively.
8. DashMachine
Dash Machine is a fantastic lightweight dashboard designed for those who prefer simplicity with a touch of elegance.
It offers a tile-based interface, where each tile represents a self-hosted application or a URL you want quick access to.
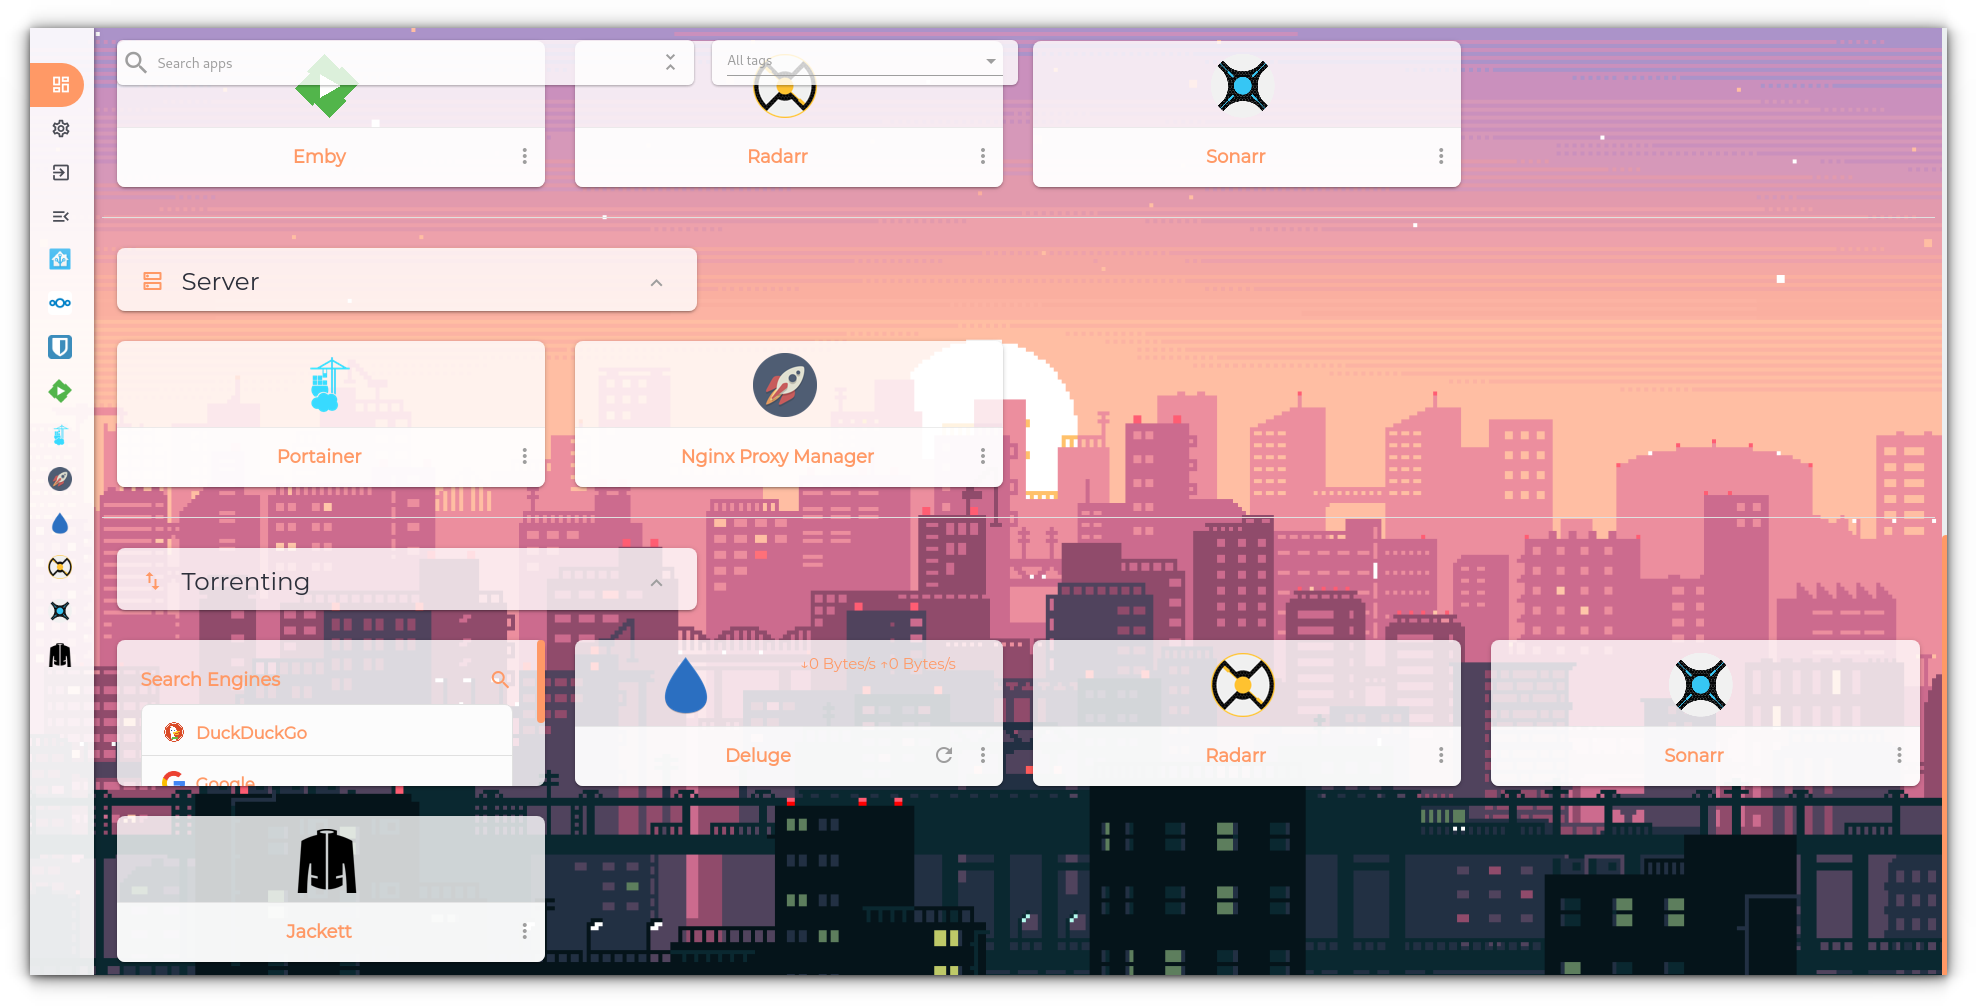
One of the standout features is its search functionality, which allows you to find and access services faster.
Installing Dash Machine is straightforward. It’s available as a Docker container, so you can have it up and running in minutes.
However, it doesn’t offer multi-user functionality or detailed service monitoring, which might be a limitation for more complex setups.
✅ Clean, tile-based design for quick and easy navigation.
✅ Lightweight and perfect for resource-constrained devices.
✅ Quick setup via Docker.
❌ Limited to static links—no advanced monitoring or multi-user support.
9 Hiccup (newbie)
Hiccup is a newer entry in the self-hosted dashboard space, offering a clean and modern interface with a focus on user-friendliness.
It provides a simple way to categorize and access your services while keeping everything visually appealing.
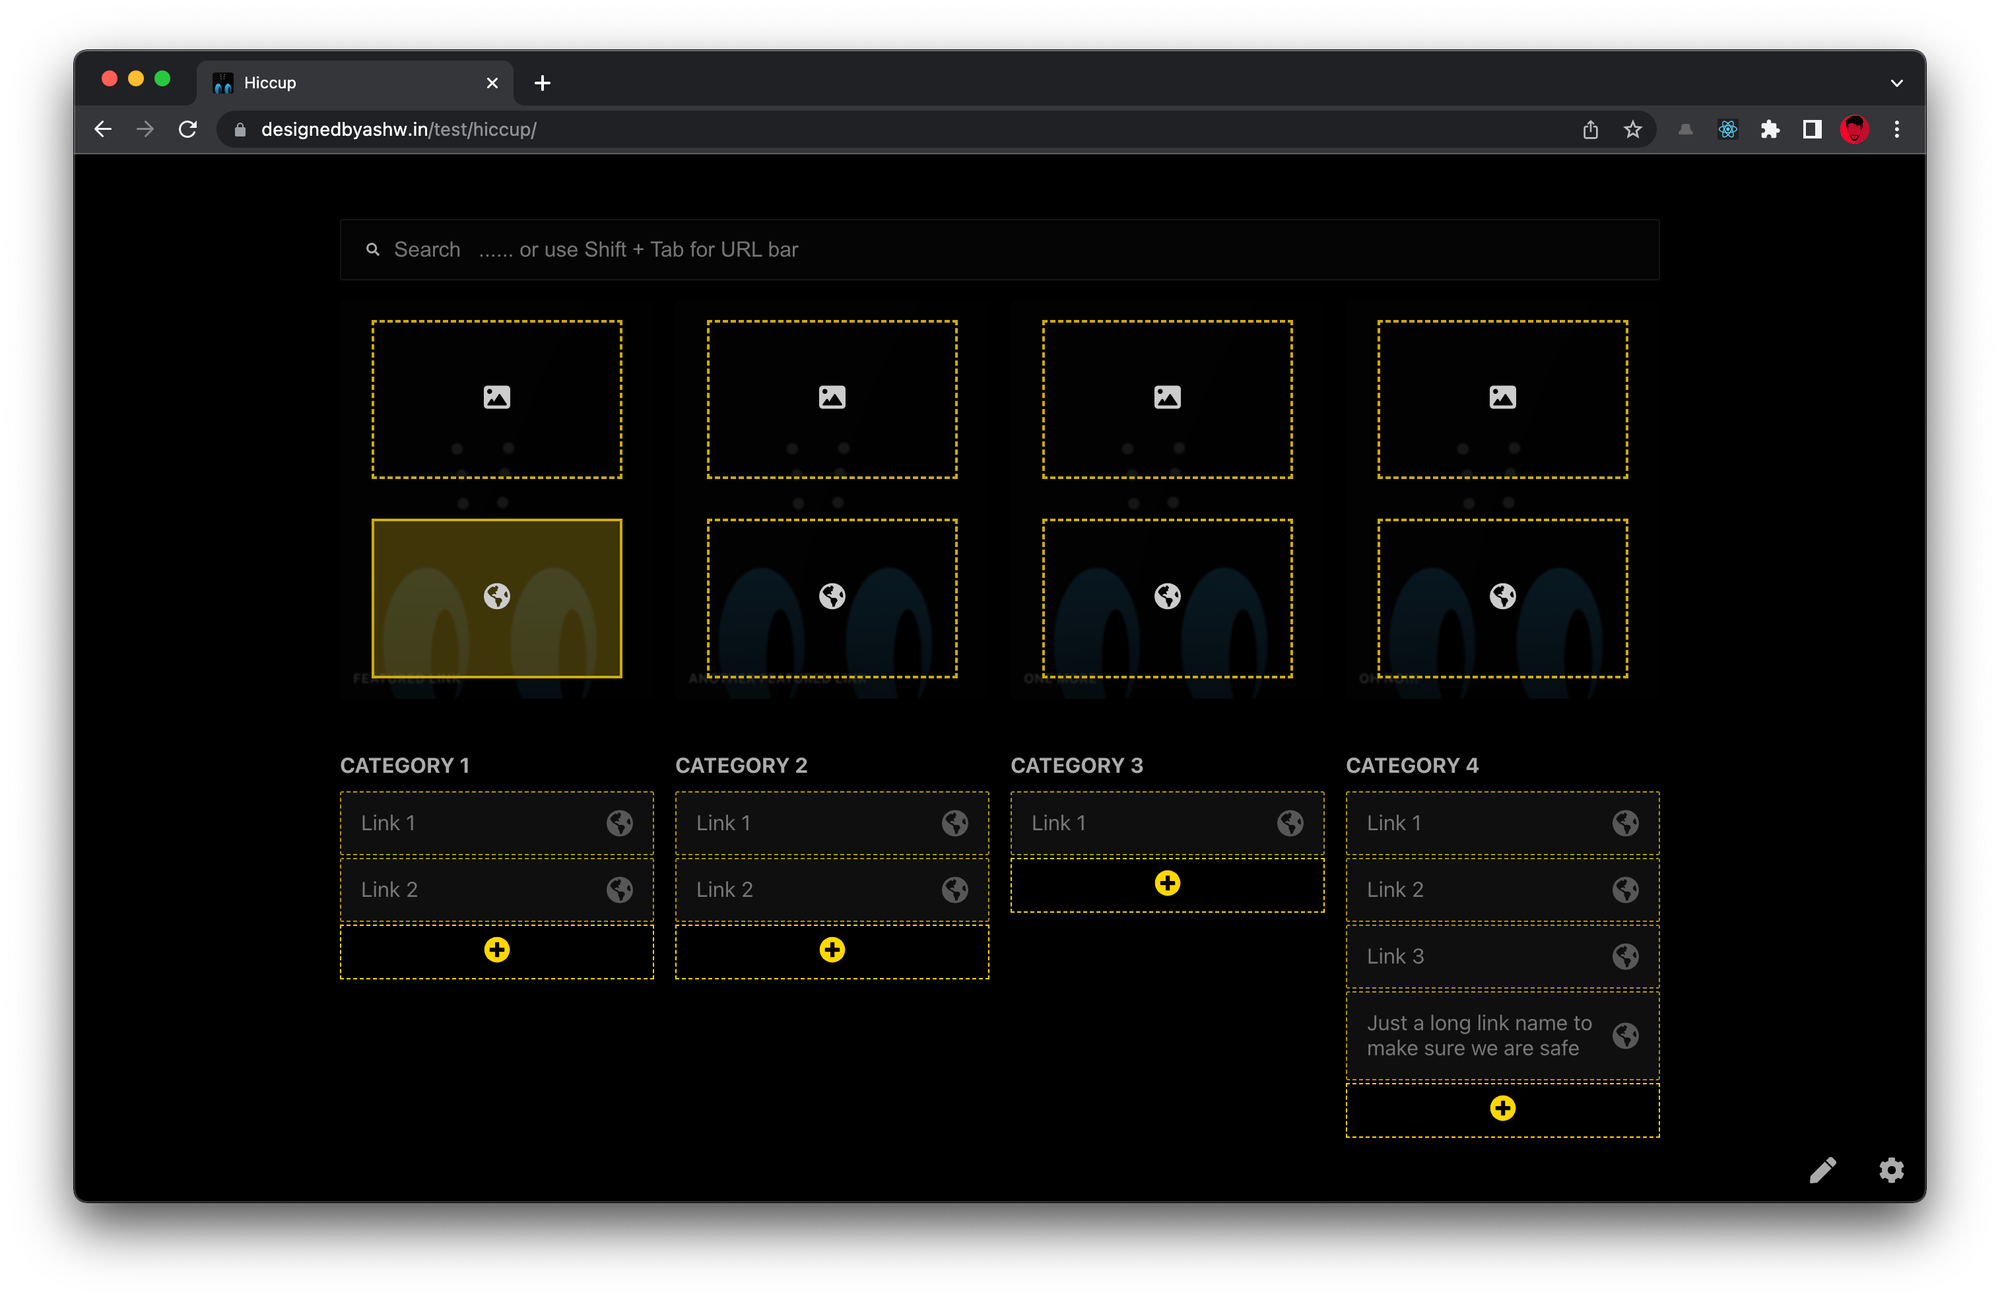
What makes Hiccup unique is its emphasis on simplicity. It’s built to be lightweight and responsive, ensuring it runs smoothly even on resource-constrained hardware like Raspberry Pis.
The setup process is easy, with Docker being the recommended method. On the downside, it’s still relatively new and it lacks some of the advanced features found in more established dashboards like Dashy or Heimdall.
✅ Sleek, responsive design optimized for smooth performance.
✅ Easy categorization and Docker-based installation.
✅ Minimalistic and beginner-friendly.
❌ Lacks advanced features and monitoring tools found in more mature dashboards.
Bonus: Smashing
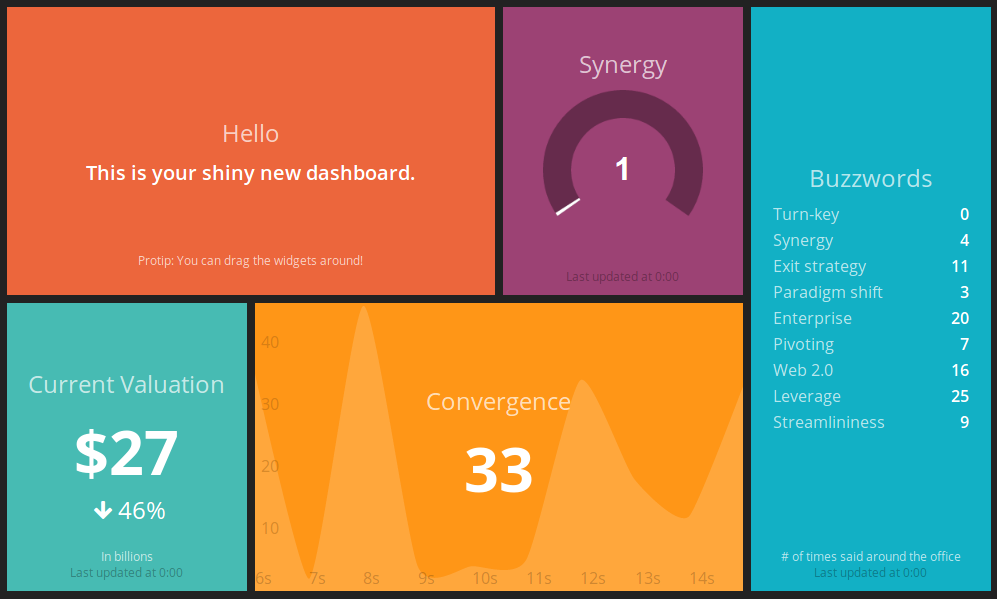
Smashing is a dashboard like no other. Formerly known as Dashing, it’s designed for those who want a widget-based experience with real-time updates.
Whether you’re tracking server metrics, weather, or even financial data, Smashing makes it visually stunning.
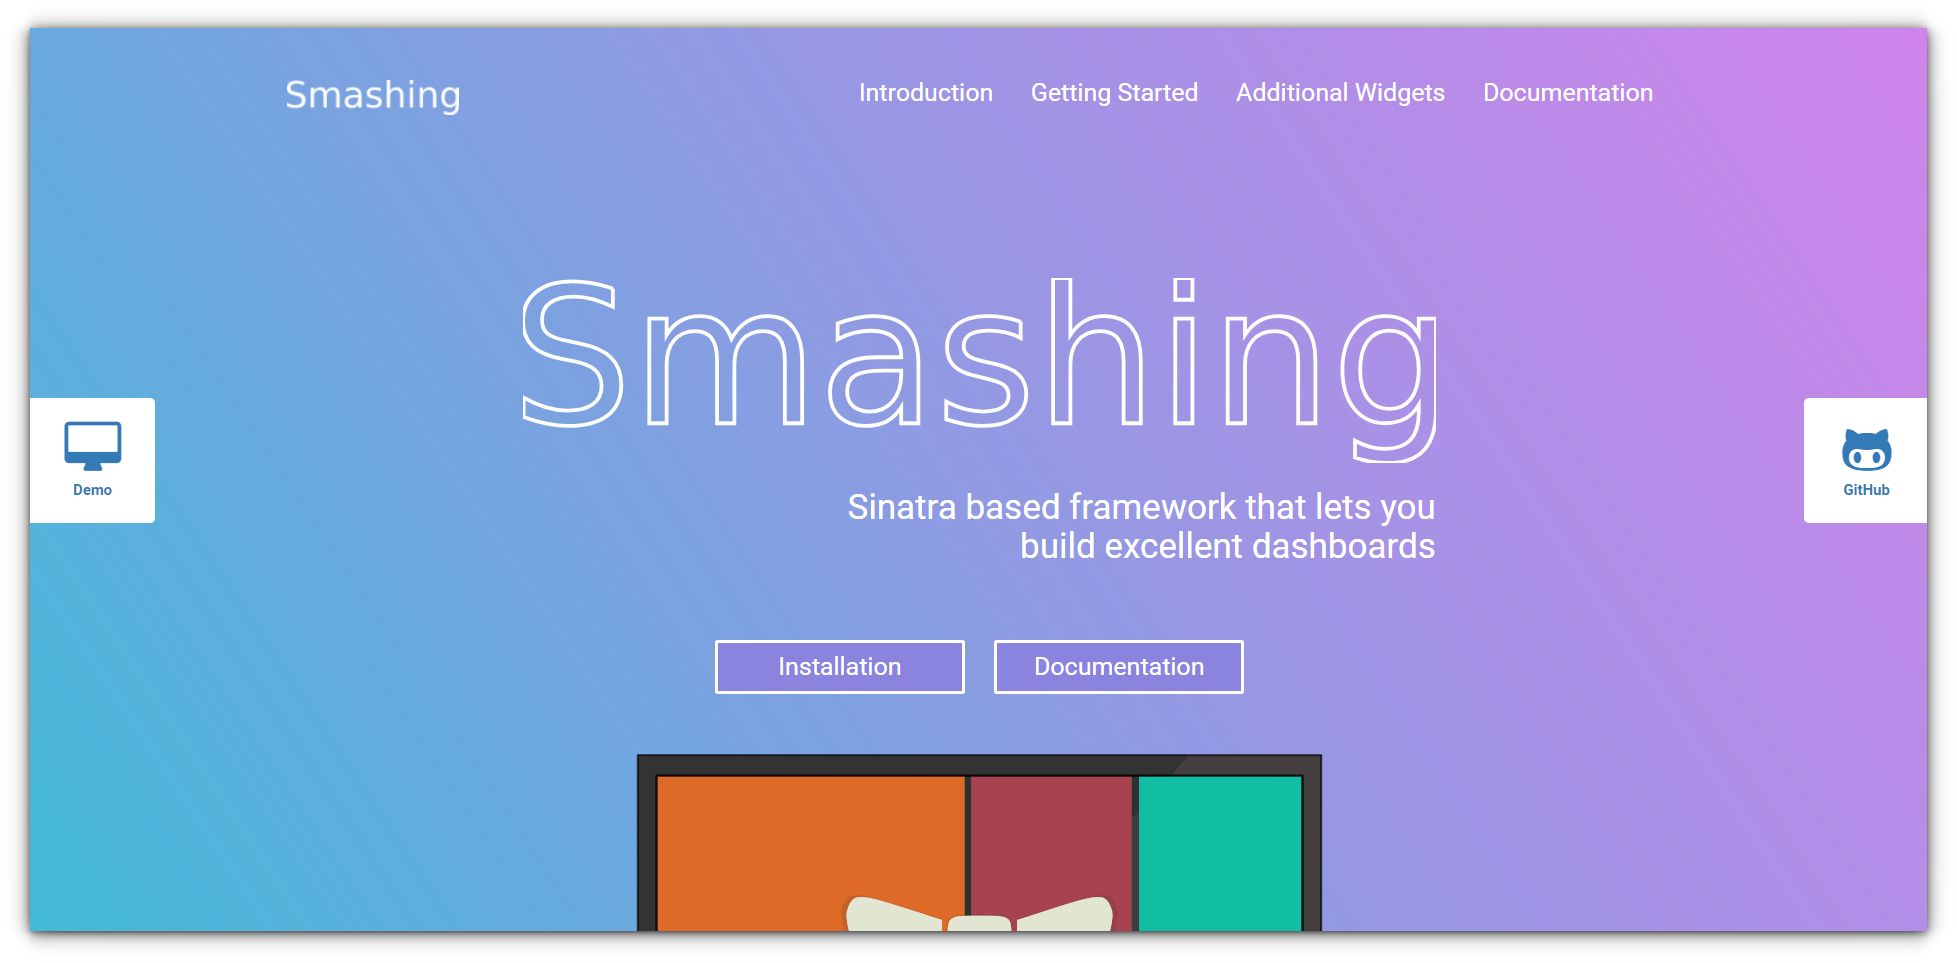
Its modular design allows you to add widgets for anything you can imagine, making it incredibly versatile.
However, it’s not for the faint of heart, Smashing requires some coding skills, as it’s built with Ruby and depends on your ability to configure its widgets.
Installing Smashing involves cloning its repository and setting up a Ruby environment.
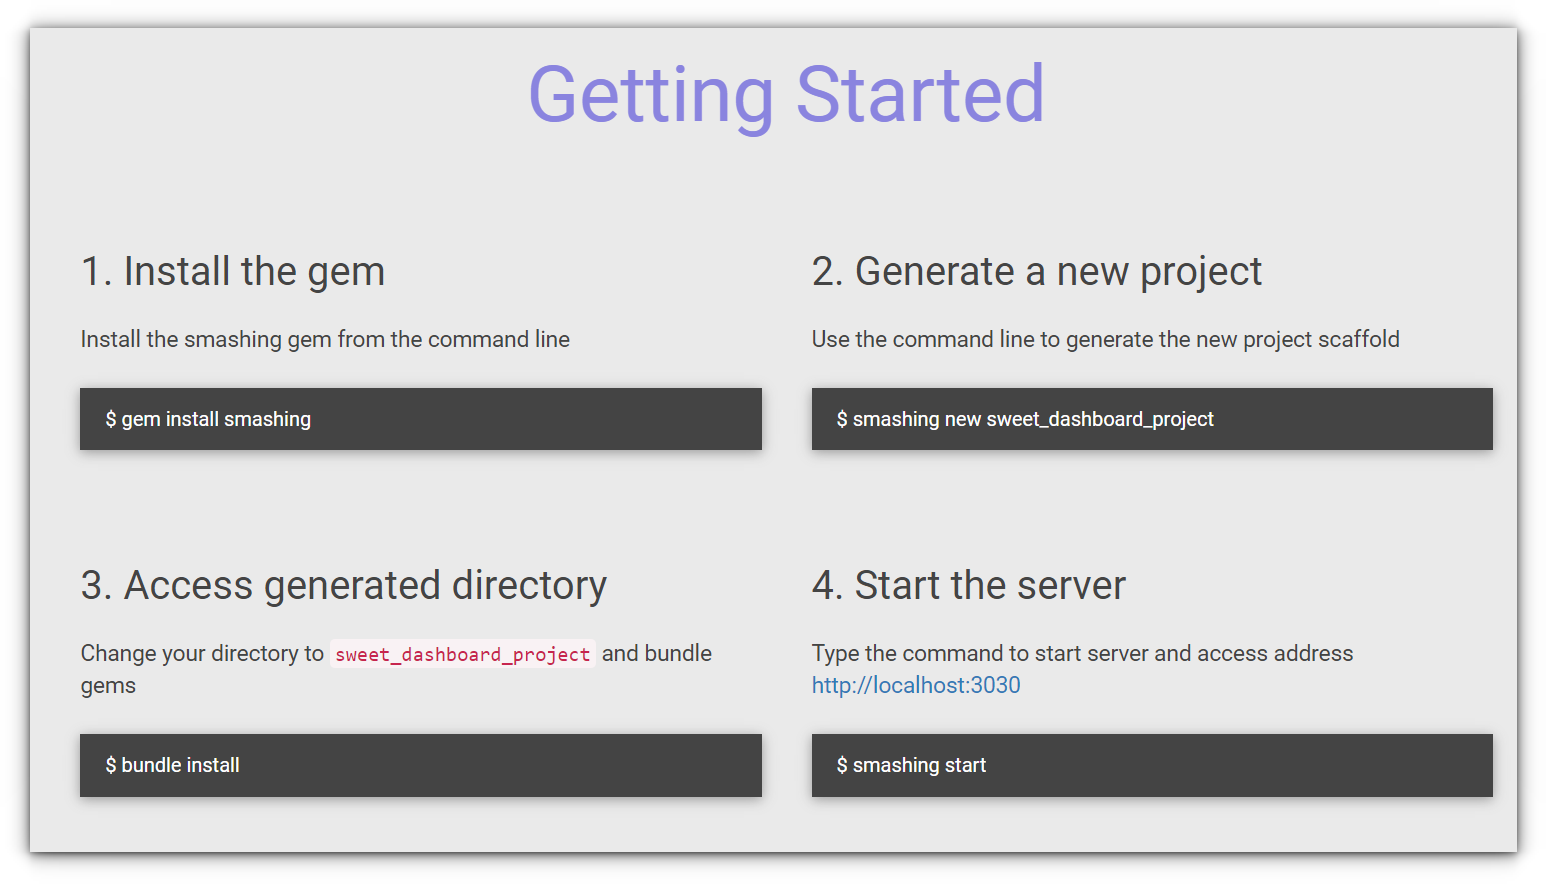
While this might sound daunting, the results are worth it if you’re aiming for a highly personalized dashboard.
✅ Modular design with support for tracking metrics, weather, and more.
✅ Visually stunning and highly customizable with Ruby-based widgets.
✅ Perfect for users looking for a unique, dynamic dashboard.
❌ Requires coding skills and familiarity with Ruby.
❌ More complex installation process compared to Docker-based solutions.
Wrapping It Up
Dashboards are the heart and soul of a well-organized homelab. From the plug-and-play simplicity of Umbrel to the enterprise-grade capabilities of UCS Server, there’s something here for every setup and skill level.
Personally, I find myself switching between Homer for quick and clean setups and Dashy when I’m in the mood to customize. But that’s just me!
Your perfect dashboard might be completely different, and that’s the beauty of the homelab community.
So, which one will you choose? Or do you have a hidden gem I didn’t mention? Let me know in the comments—I’d love to feature your recommendations in the next round!

![Hostname vs Domain Name: What's the Difference? [With Example]](https://matchpage.info/wp-content/uploads/2024/10/hostname-vs-domain-name-whats-the-difference-with-example-768x514.png)
